

Axon News and Articles

Solving Sports Analytics at Scale: An Independent View of Axon Perform
Global data leader Adam Morton sat down with Axon Perform founder Jon Foote. What he found was a platform quietly solving one of elite sport's most persistent problems, and doing it at a fraction of the cost of building it yourself.
From Instinct to Structure: How Elite Tactical Thinking Shapes What We Build
Axon Perform Data Scientist Ben Salisbury recently completed the Certificate in Football Tactical Analysis at the Barça Innovation Hub, FC Barcelona's globally respected education and innovation arm. Here's what he learned, why it matters, and how elite tactical thinking shapes the tools we build for high-performance sport.
Connect Claude to Power BI Desktop
This quick tutorial walks you through connecting Claude AI to Power BI Desktop using the free MCP Server extension. Once set up, Claude can read your data model, write DAX, and help you build measures, all from a simple chat interface. It takes about fifteen minutes and completely changes the way you work with your reports.
3 ways to improve long-term analysis of performance data
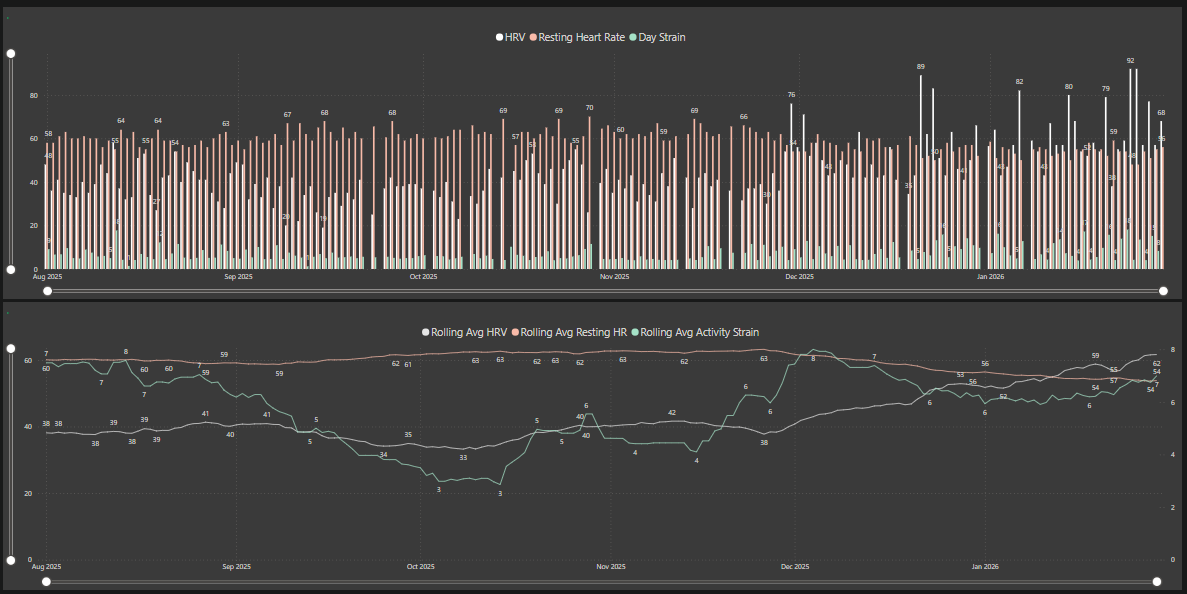
Tracking metrics such as HRV, Resting HR and Daily Strain can provide valuable insight into how the body responds to training and life stress. However, daily data in isolation can be misleading. A single strong or weak reading offers limited insight into long-term direction.
By combining relevant metrics, analysing them over a rolling 90-day period, and removing visual distortion from charts, clearer patterns begin to emerge. The key lesson is simple: long-term performance is shaped by trends, not isolated data points. The advantage lies not in collecting more data, but in analysing it with discipline.
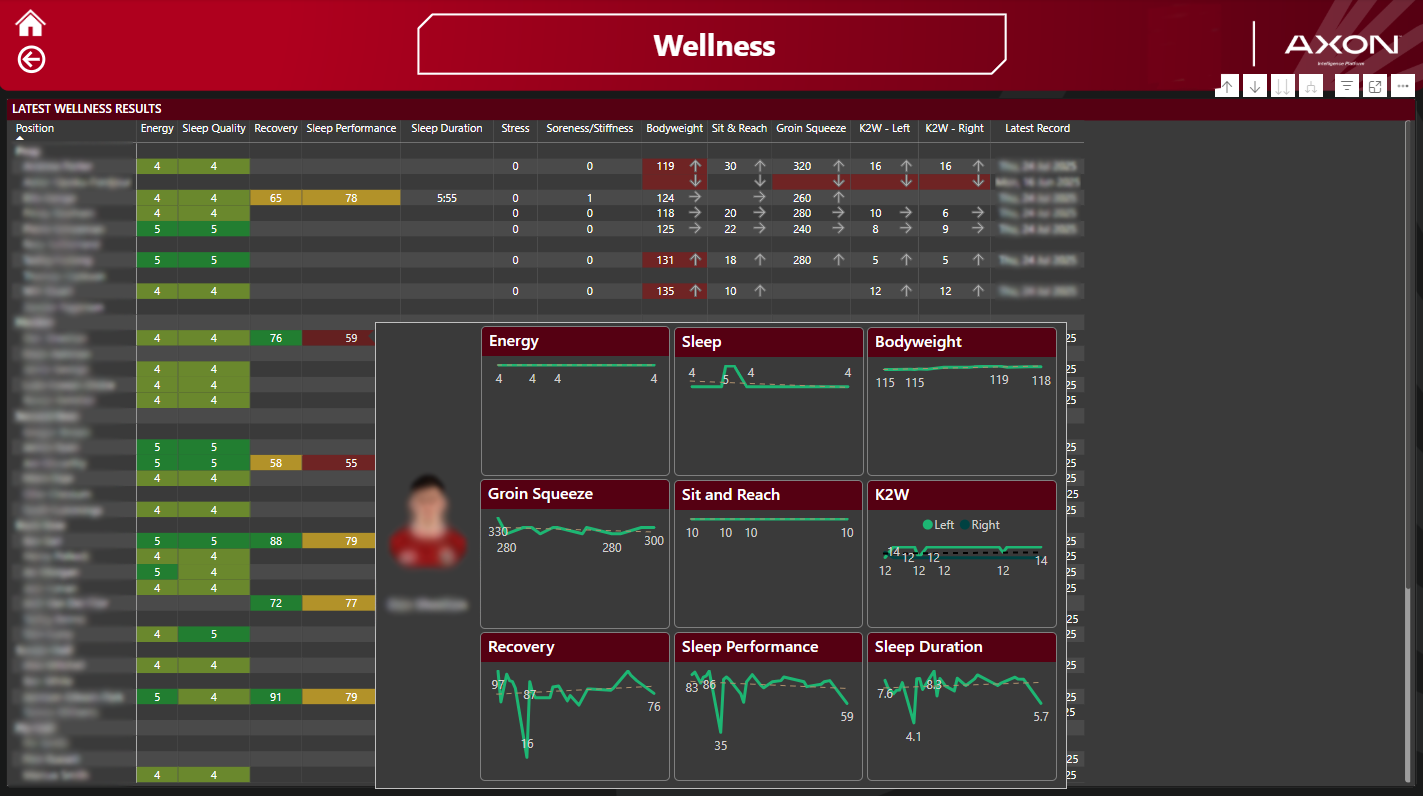
How to create Custom Tooltips in Power BI for Wellness & WHOOP trends
Daily wellness and wearable data can be really useful… or really misleading.
One low score might be an early warning sign or it might just be noise.
When you’re tracking 10+ measures across 30+ athletes every day, it becomes almost impossible to tell which is which without adding context.
Recently we built a reporting suite for a customer that brought Game, GPS, Wellness and WHOOP data together in one place.
The challenge is that trying to visualise daily values and longer-term trends on the same report page gets messy fast.
So we solved it using Custom tooltips in Power BI
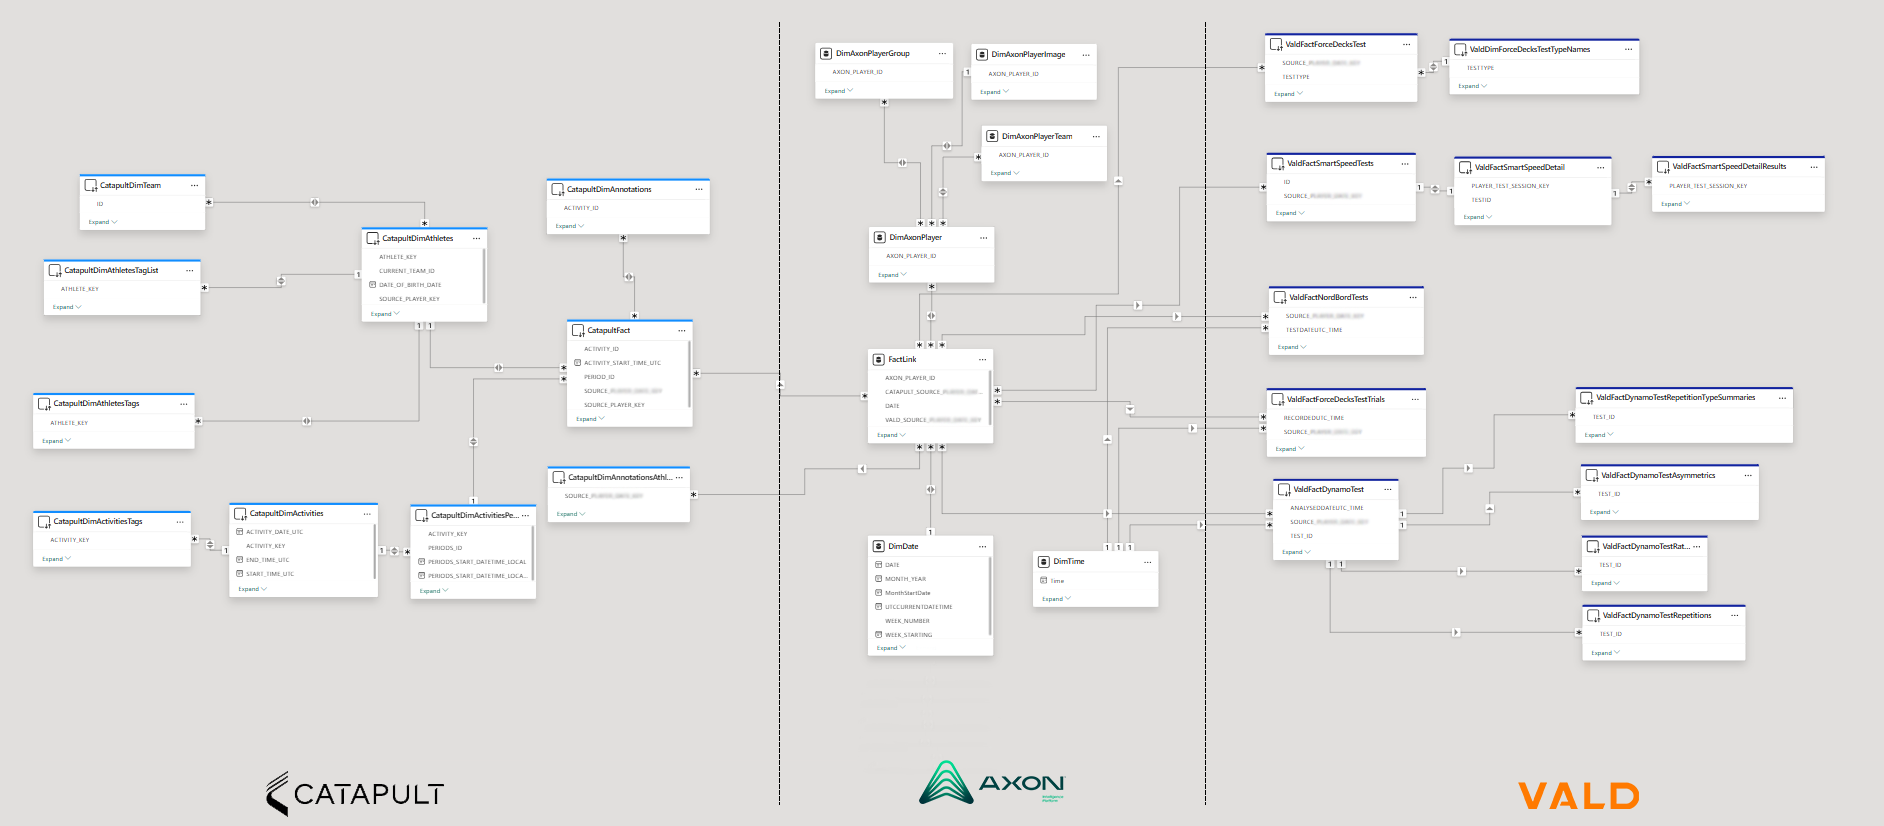
How Axon Merges Multiple Data Sets in Power BI
How Axon Merges Multiple Data Sets in Power BI: In this article will look under the hood to walk you through the design from the end back to the start so you can see how the architecture works and why we’ve built it this way.

Axon: Sports Data Platform of the Future
Jon joins Ryan Bridge on Herald NOW to discuss how Axon Perform is transforming how sports teams handle data and analytics.

Rugby’s game-changing tech
The modern game is relentless. Where's power in space? Every moment, every metre tracked. But behind every play, there's a story only the data can tell.

City firm giving global sports team the edge
What do the All Blacks, the Springboks and the British and Irish Lions have in common — aside from all being rugby teams?