

THE AXON AI PERFORMANCE FRAMEWORK
From fragmented data
to AI embedded in daily decisions.
Five stages, three tiers. The process we use to take a performance department from scattered source systems to a working AI layer that thinks in your language and surfaces the right information before the decision gets made without it.
One trusted core. Your edge drive the outcomes.
Coaches, analysts and athletes each work in their own way. Every question routes through the same central data store, so the numbers hold across every system. Your staff build the measures, reports and models that win games, defined your way.
Axon HQ
Operations, medical, availability, wellness, forms and files in one place.
Ask Axon
Ask in plain English. Analysis and reports your staff build, own and trust.
Axon Pulse
Wellness check-ins, load and recovery, wearables data collected automatically.
MCP semantic layer
The reason your numbers stay consistent. Ask the same question of GPS, Force Sensors, Wellness or Match data and the definitions hold, so you can compare a player to a player, or your side to the opposition, and trust the answer. Your analysts build their own measures and logic on top, defined your way, not forced into someone else's template.
Data
A dedicated Snowflake warehouse, managed by us. All of your integrations connected, tested and kept current, so your analysts stop moving data and start reading it.
THE PROBLEM THIS FRAMEWORK SOLVES
This is not a
data problem.
Most elite sports departments have more data than ever. More systems, more analysts, more dashboards.
And yet the Manager or Head Coach still makes the selection call the same way they did a decade ago. A conversation with the physio, experience, and whatever the analyst managed to pull together prior to the meeting.
The data exists. The decisions don't change.
It's a decision problem. The data isn't connected to the moment the decision needs to be made, in the format the decision-maker can use, at the speed the game demands. The Axon AI Performance Framework is the process we use to close that gap.
THE FRAMEWORK
Five stages.
From data collection to AI-embedded
decisions.
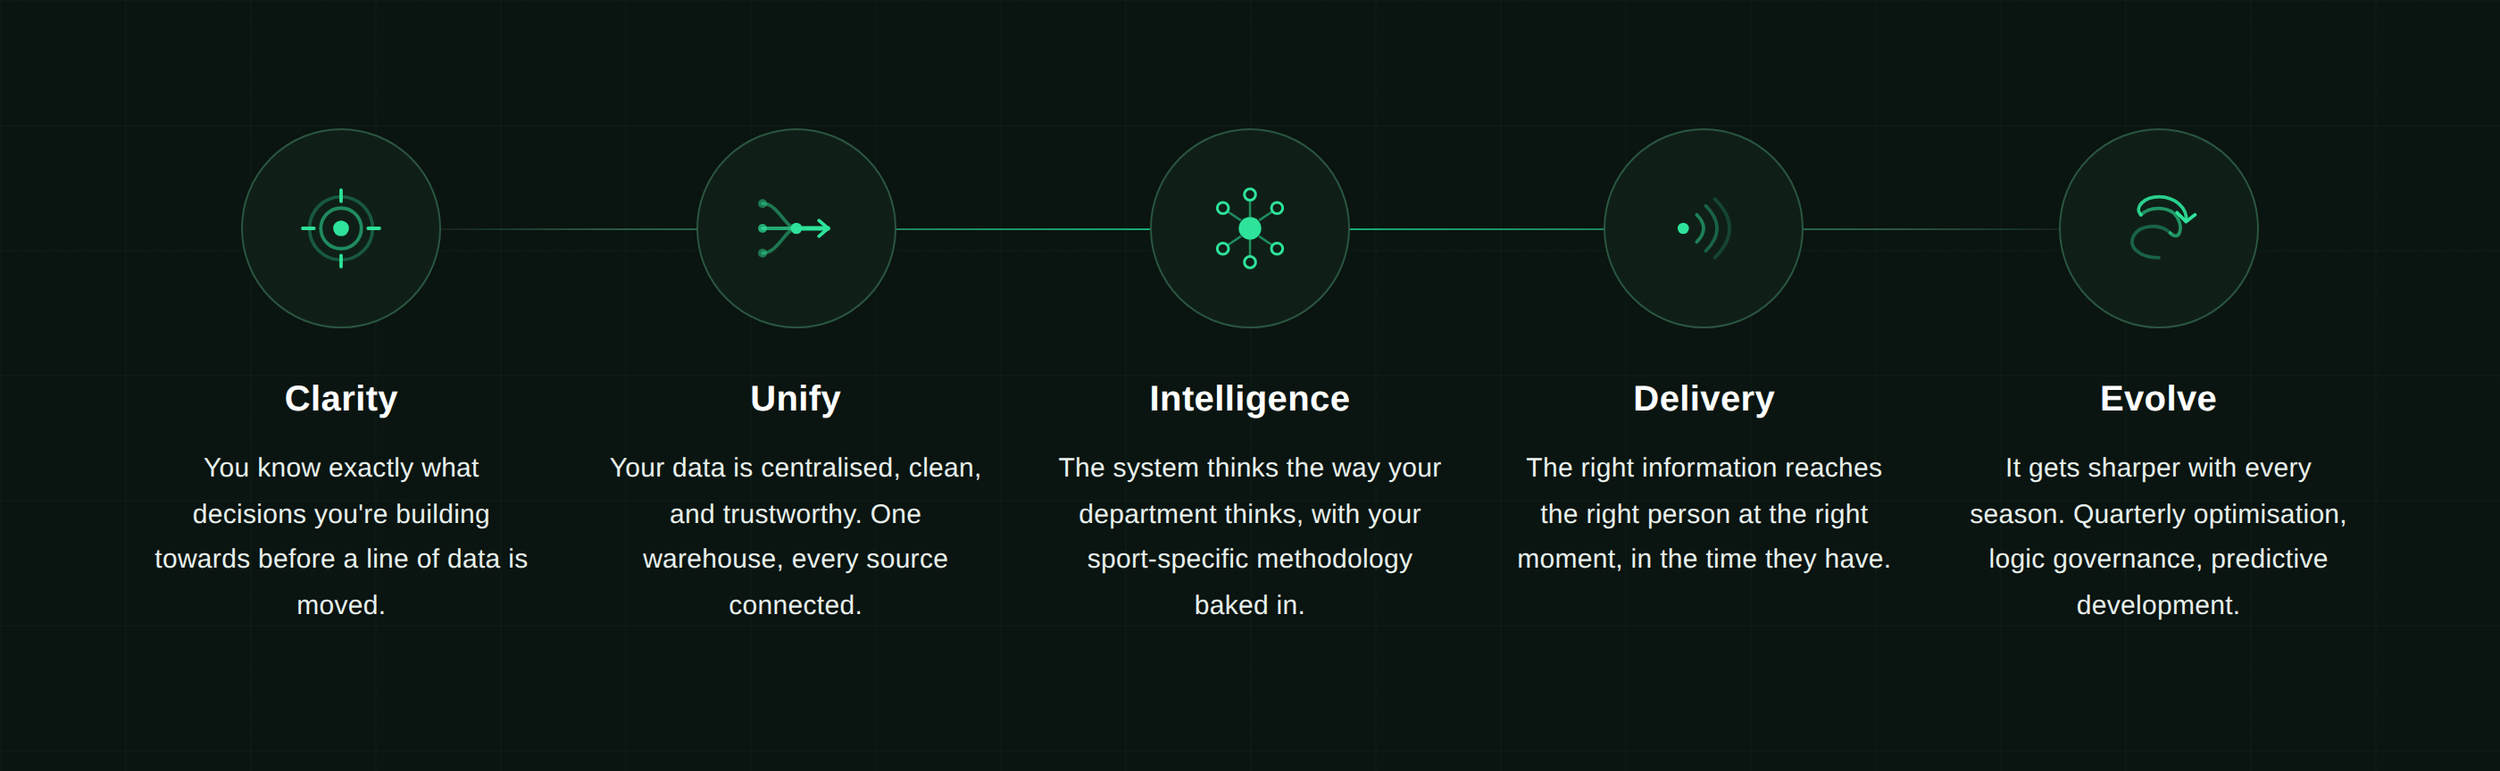
CLARITY
01
You know exactly what decisions you're building towards.
We don't start with your data. We start with your game day.
Before anything is built, we map the two or three decisions that matter most to your department. Selection. Load management. Return to play. These are the decisions the system needs to support.
We also map the people. Who makes the call, who has the authority to override a red flag, where data gets ignored in favour of gut feel and why.
The phase ends with one document everyone signs off on. The Decision Architecture is the foundation everything else is built on.
UNIFY
02
Your data is centralised and trustworthy for the first time.
AI logic is only as sharp as the data it feeds on.
This is where most implementations fail. Teams assume their data is cleaner than it is.
We map all of it, not to judge but to design around it. The architecture reflects your actual data, not an idealised version of it.
You get a working Snowflake warehouse. Your data centralised, versioned, and queryable for the first time.
INTELLIGENCE
03
The system thinks the way your department thinks.
A generic AI answers generic questions. We're not building a generic AI.
This phase is where the system learns your department. Your language, your thresholds, your philosophy, your history. The difference between an AI that says "Player A has an elevated ACWR", and one that says "based on Tuesday's session and the travel day Thursday, he's carrying more than you'd want heading into Sunday, and this is the same pattern you saw before his hamstring in March."
We call this the Context Library. A set of configuration files that teach your AI everything it needs to interpret your data in your terms.
Your performance philosophy stops living in people's heads and starts living in the system.
DELIVERY
04
The right information reaches the right person at the right moment.
An insight sitting in a database is worthless.
The last mile is what matters. Getting information from the system to the human, in the right format, before the decision gets made without it.
For most departments that's two things. Automated daily reporting that arrives before anyone asks. And on-demand questions answered in plain English, mid-week or pre-match, when something unexpected happens in training.
Analysts freed from assembly. Coaches asking the system directly. Reports shareable across staff without anyone needing to be technical. A live system your staff actually use.
EVOLVE
05
It gets sharper with every season.
The first season is about getting the system right. The second is where it starts to anticipate.
As the system accumulates data, the questions it can answer get harder. Year 1 question: "Is this player's load elevated this week?" Year 2: "Based on two seasons of data, what are the leading indicators that this player is four weeks from a soft-tissue injury?" Different question, different system.
This phase also keeps pace with your programme. Rosters change. Coaches change. Your tactical system evolves. The AI evolves with it.
Not a project that delivers and sits still. A platform that grows with your programme.
SERVICE TIERS
Three ways to work with us.
The framework runs across three tiers, depending on where your department is starting from and what level of partnership makes sense.
FOUNDATION
For departments where the data exists but doesn't yet add up to a system.
Foundation turns six source systems into one, and gives your analysts back the hours they spend moving data instead of interpreting it.
Covers stages 01 → 03
Data spread across systems that don't talk. Analysts spending more time moving data than interpreting it. Foundation gets everything into one place and makes it queryable.
What's included
Decision Architecture document
Snowflake warehouse setup
Primary data source connections
AI layer with schema, context files, terminology
Core report library, three to five pre-built reports
Analyst onboarding
INTELLIGENCE
For departments where the data is in place but the decisions still happen the old way.
Intelligence puts the answers in front of the Head Coach before they ask, and turns mid-week questions from 24-hour waits into 30-second conversations.
Covers all five stages
Your data exists. The gap is that it's not connected to the decisions your staff are making. The morning report should arrive before anyone asks. The Head Coach should get an answer mid-week without waiting 24 hours.
Everything in Foundation, plus
Full data source audit and integration across all systems
Decision Architecture deep-dive into your specific rules and thresholds
Expanded report and query library covering all primary decisions
Productionised report delivery with shared access for coaching staff
Ask Axon access for analysts and coaching staff
Quarterly optimisation sessions in Year 1
Consumption and ROI reporting
PARTNER
For departments treating AI as core infrastructure, not a pilot.
Partner gets it embedded across medical, S&C, and performance, and keeps making it sharper season by season.
All five stages, ongoing
You have analytical capability and coaching buy-in. The question is whether AI is genuinely embedded in daily decisions or still running as a pilot. Partner gets it embedded, then keeps making it sharper season by season.
Everything in Intelligence, plus
Logic Governance session with medical, S&C, and performance leads
Medical and RTP integration layer
Bespoke report design to your club's brand standards
Monthly optimisation sprints
Predictive capability development as data matures
Dedicated capacity for new questions and use cases
The compounding return.
Year 1 is about getting the system right.
Year 2 is where the platform starts to anticipate. Two seasons of clean data answers questions you couldn't ask in Year 1: which load patterns precede soft-tissue injury by four weeks, which match-day combinations consistently outperform expected, which recruitment targets fit your role profile across league strength. Axon clients renew because the system gets sharper every season, not because the contract auto-renews.

FIND YOUR STARTING POINT
Which tier is right for your department?
Twenty questions across four sections. Five minutes. You'll get a clear picture of where you sit and a direct route into the right conversation.
20 questions / 4 sections / 5 minutes