

Proven Templates, Ready to Deploy
Pre-built by expert analysts to accelerate setup, then fully customisable to fit your team’s requirements.
Built For Real Performance Environments
Axon isn’t a blank canvas.
It’s built with proven performance templates developed for analysts, coaches, and sports scientists working in elite environments. Each template is designed to answer the questions teams want to ask.
You can adapt and extend every template, but you don’t start from scratch.
Get Your Team Up and Running
-
![]()
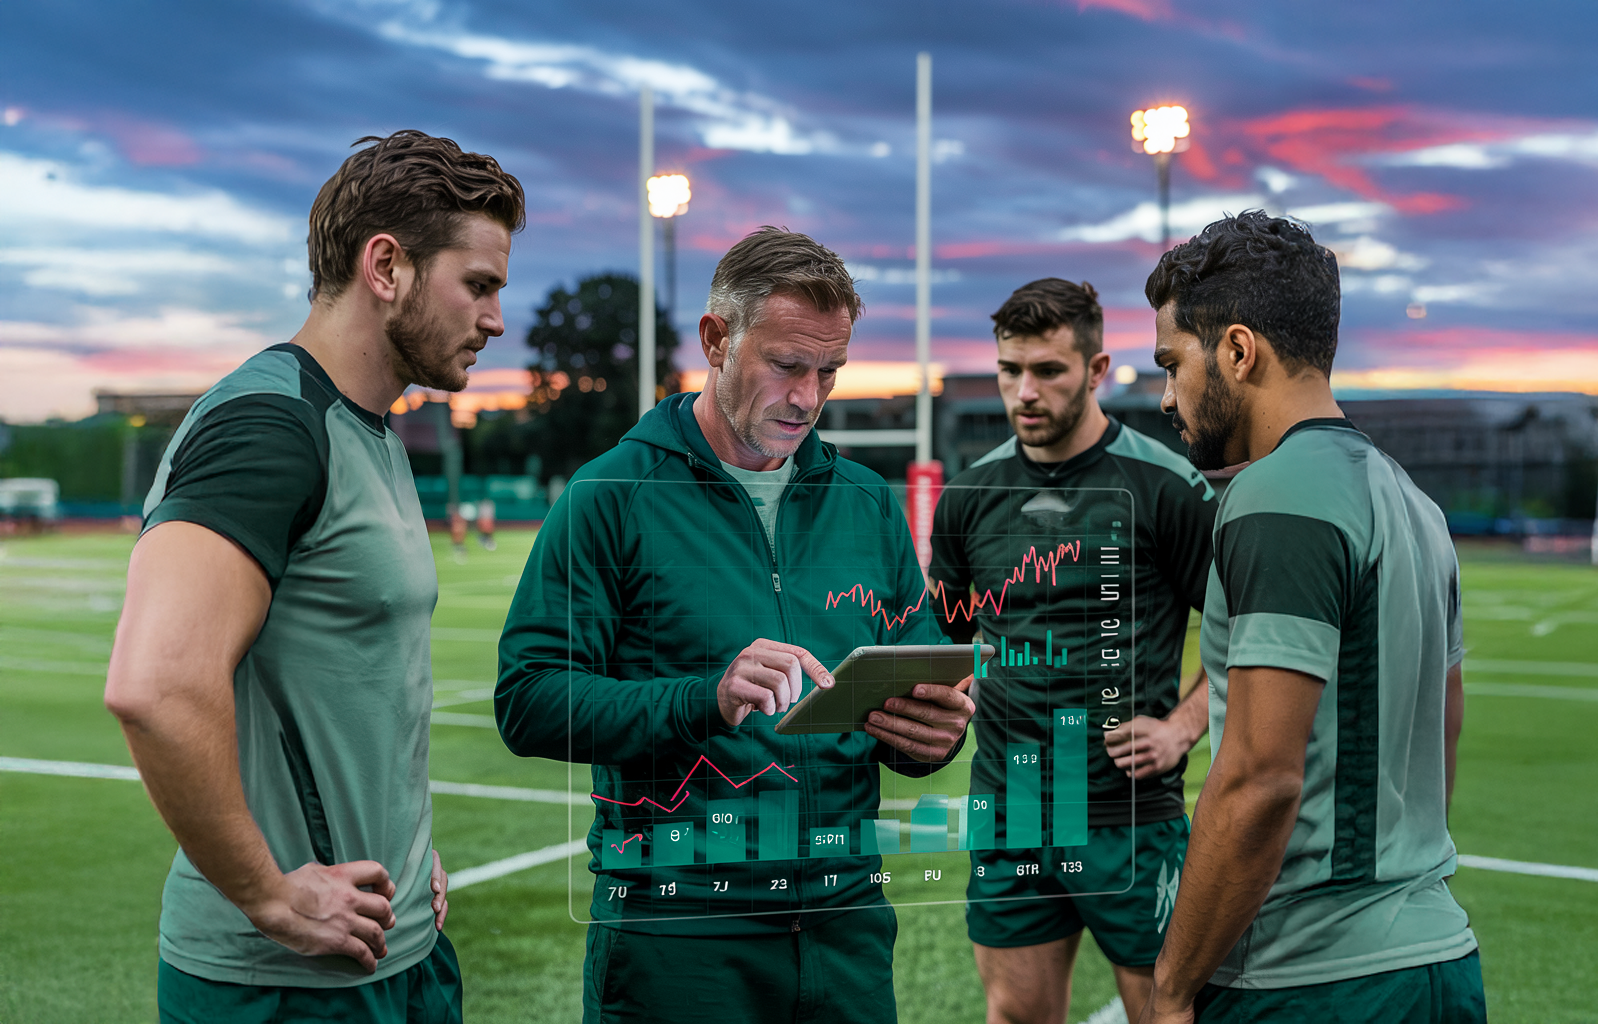
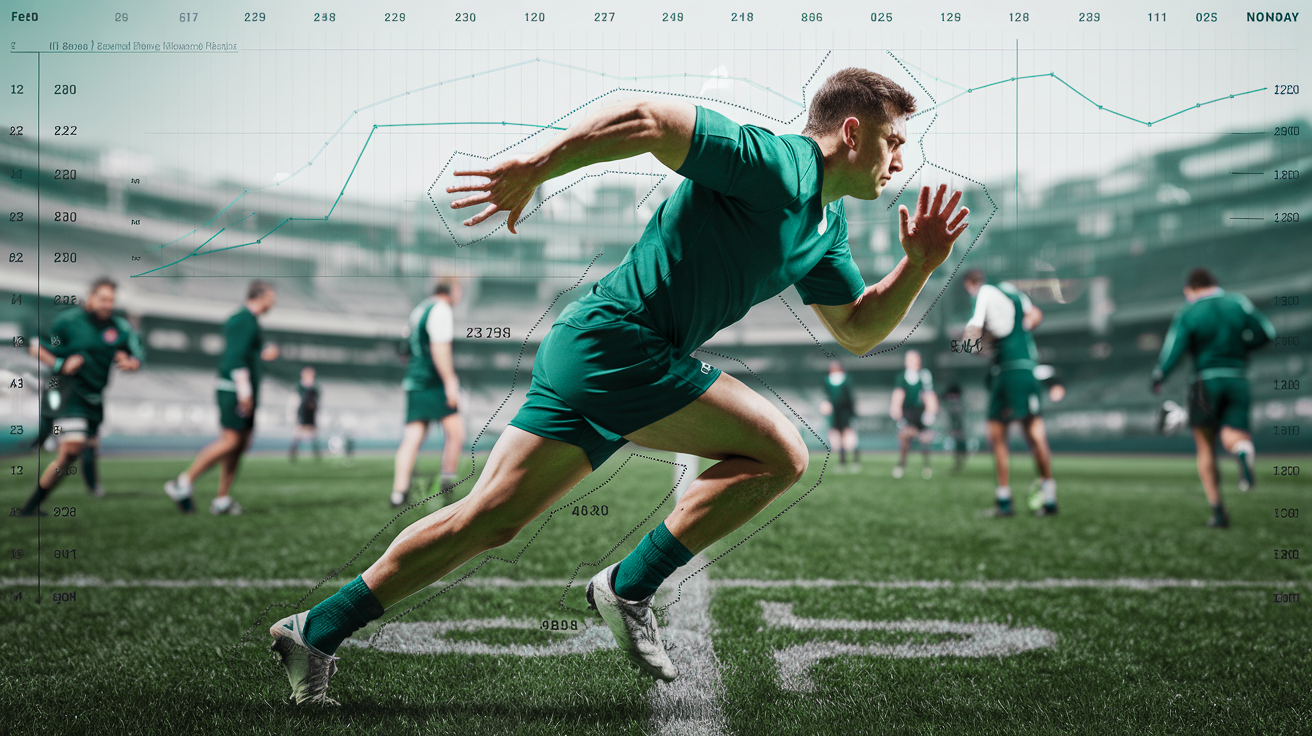
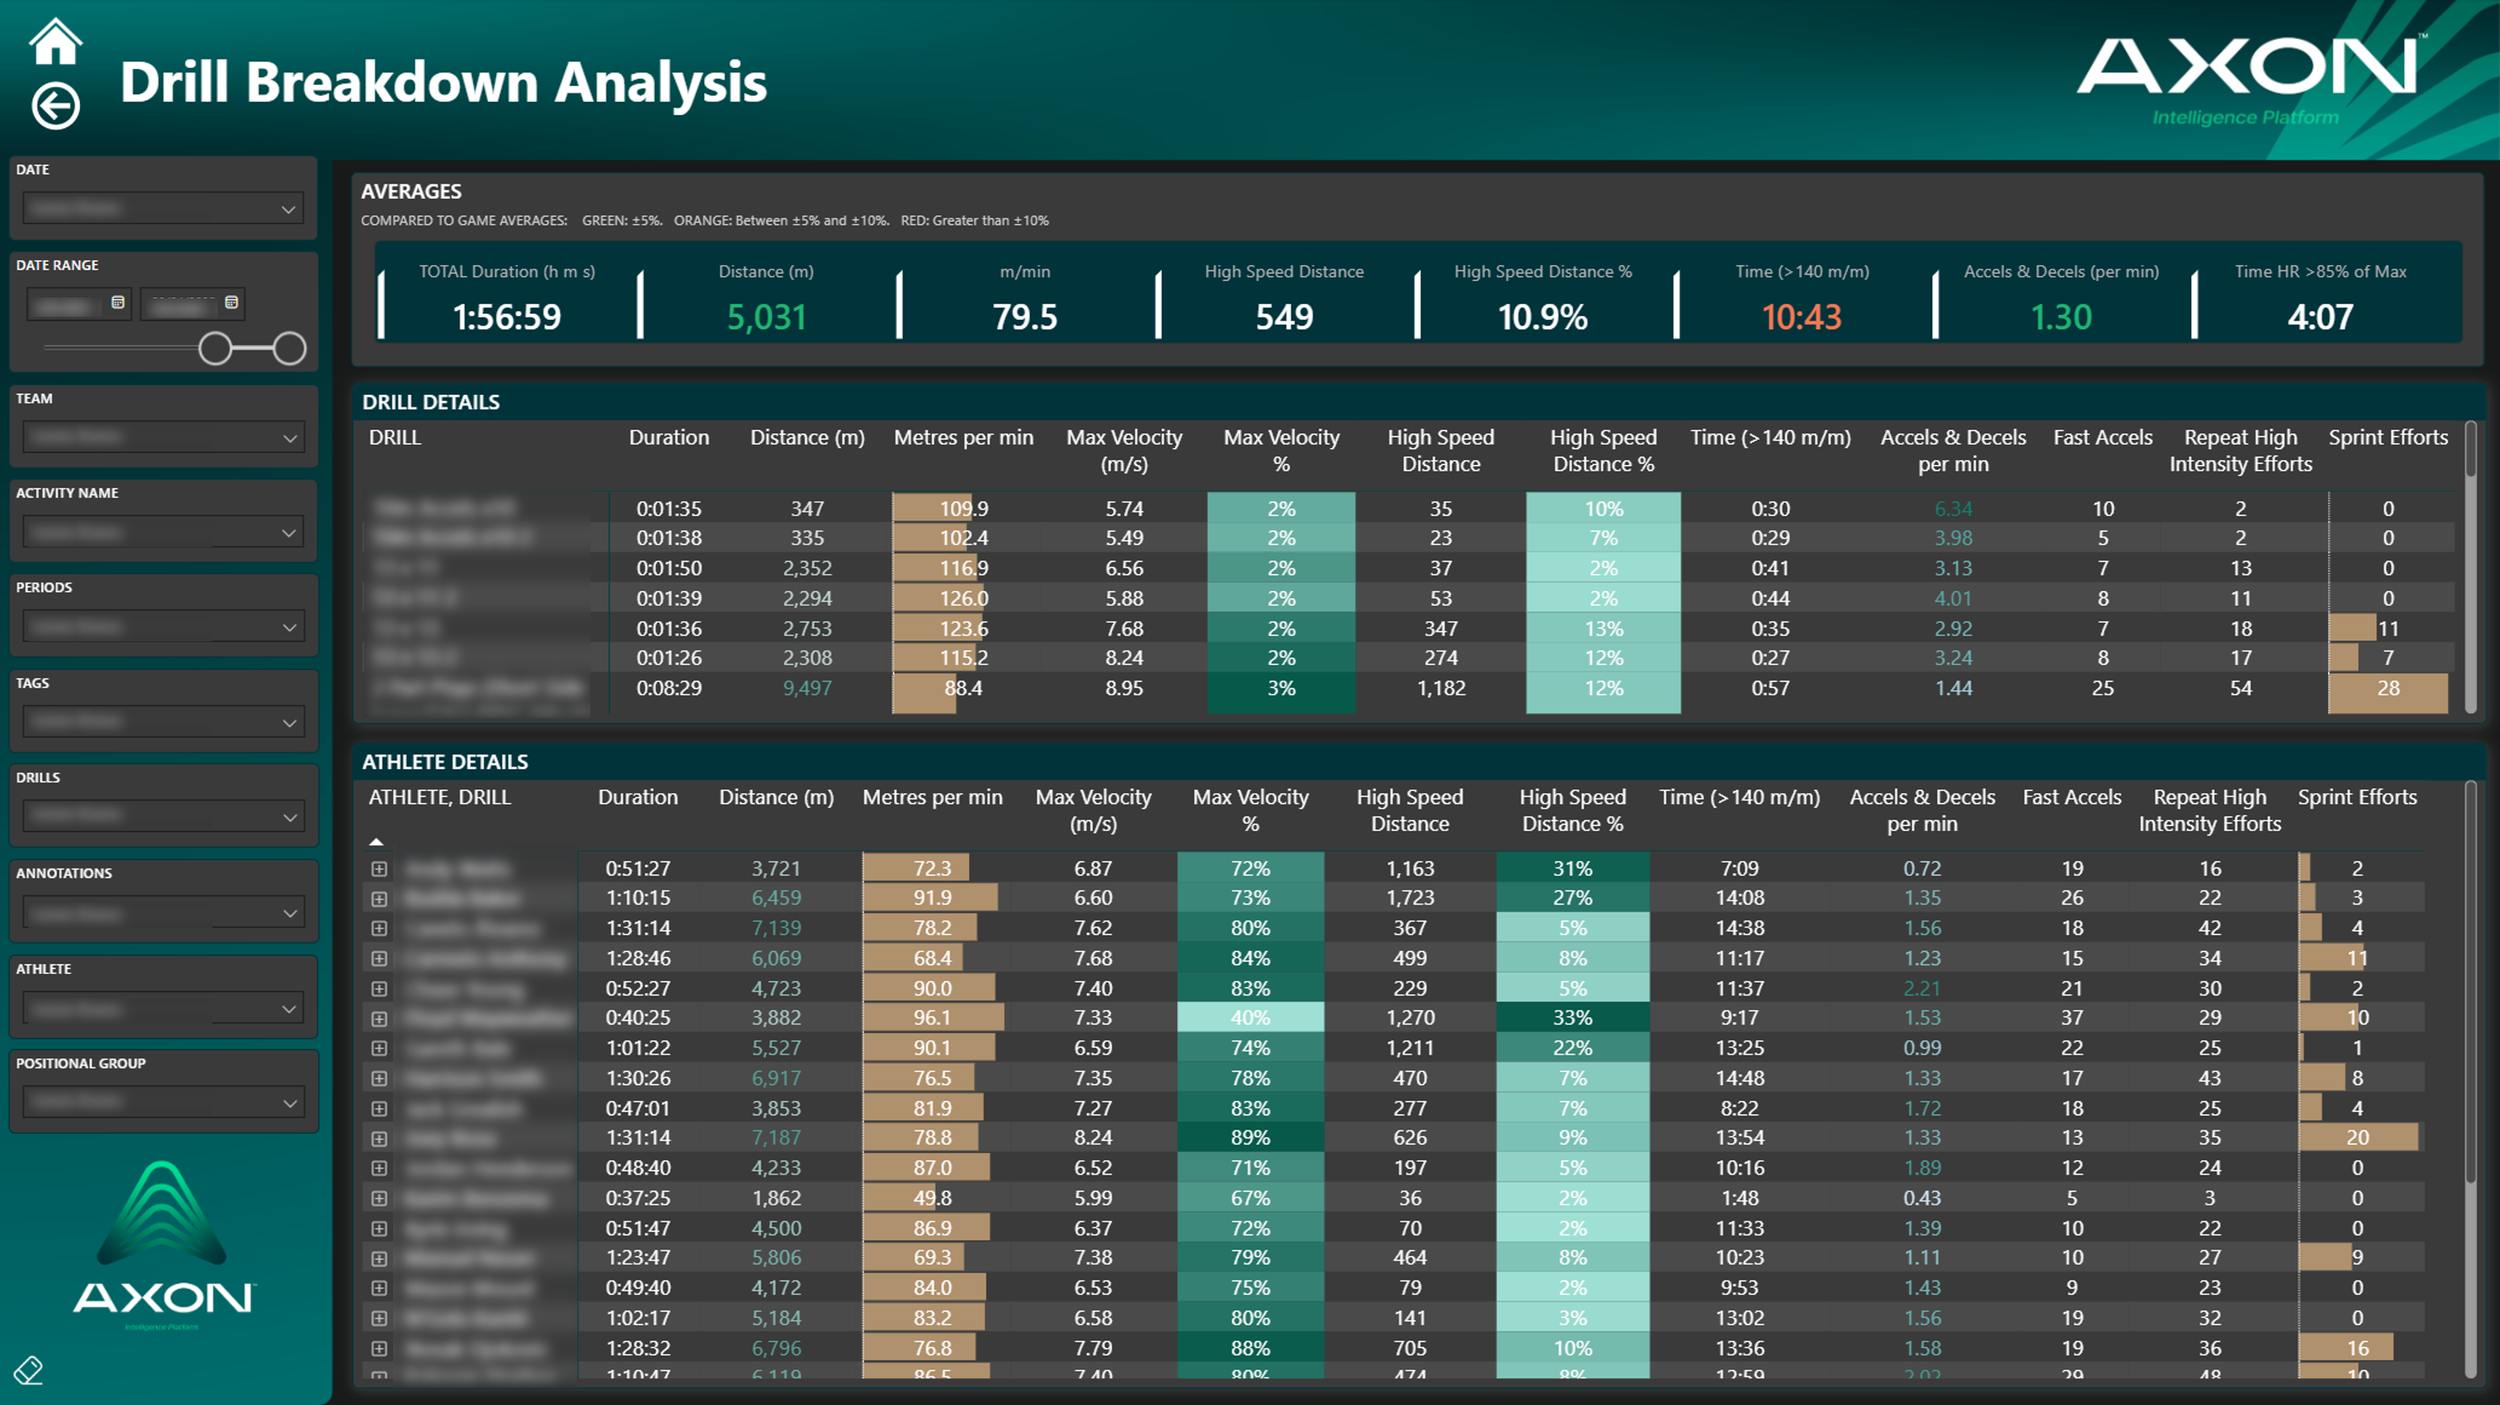
GPS Performance
Turn tracking data into clear insight on load, work rate, and physical output in training and competition.
LOAD MANAGEMENT | CONTACTS | SPEED EVENTS | FIELD POSITIONING
-
![]()
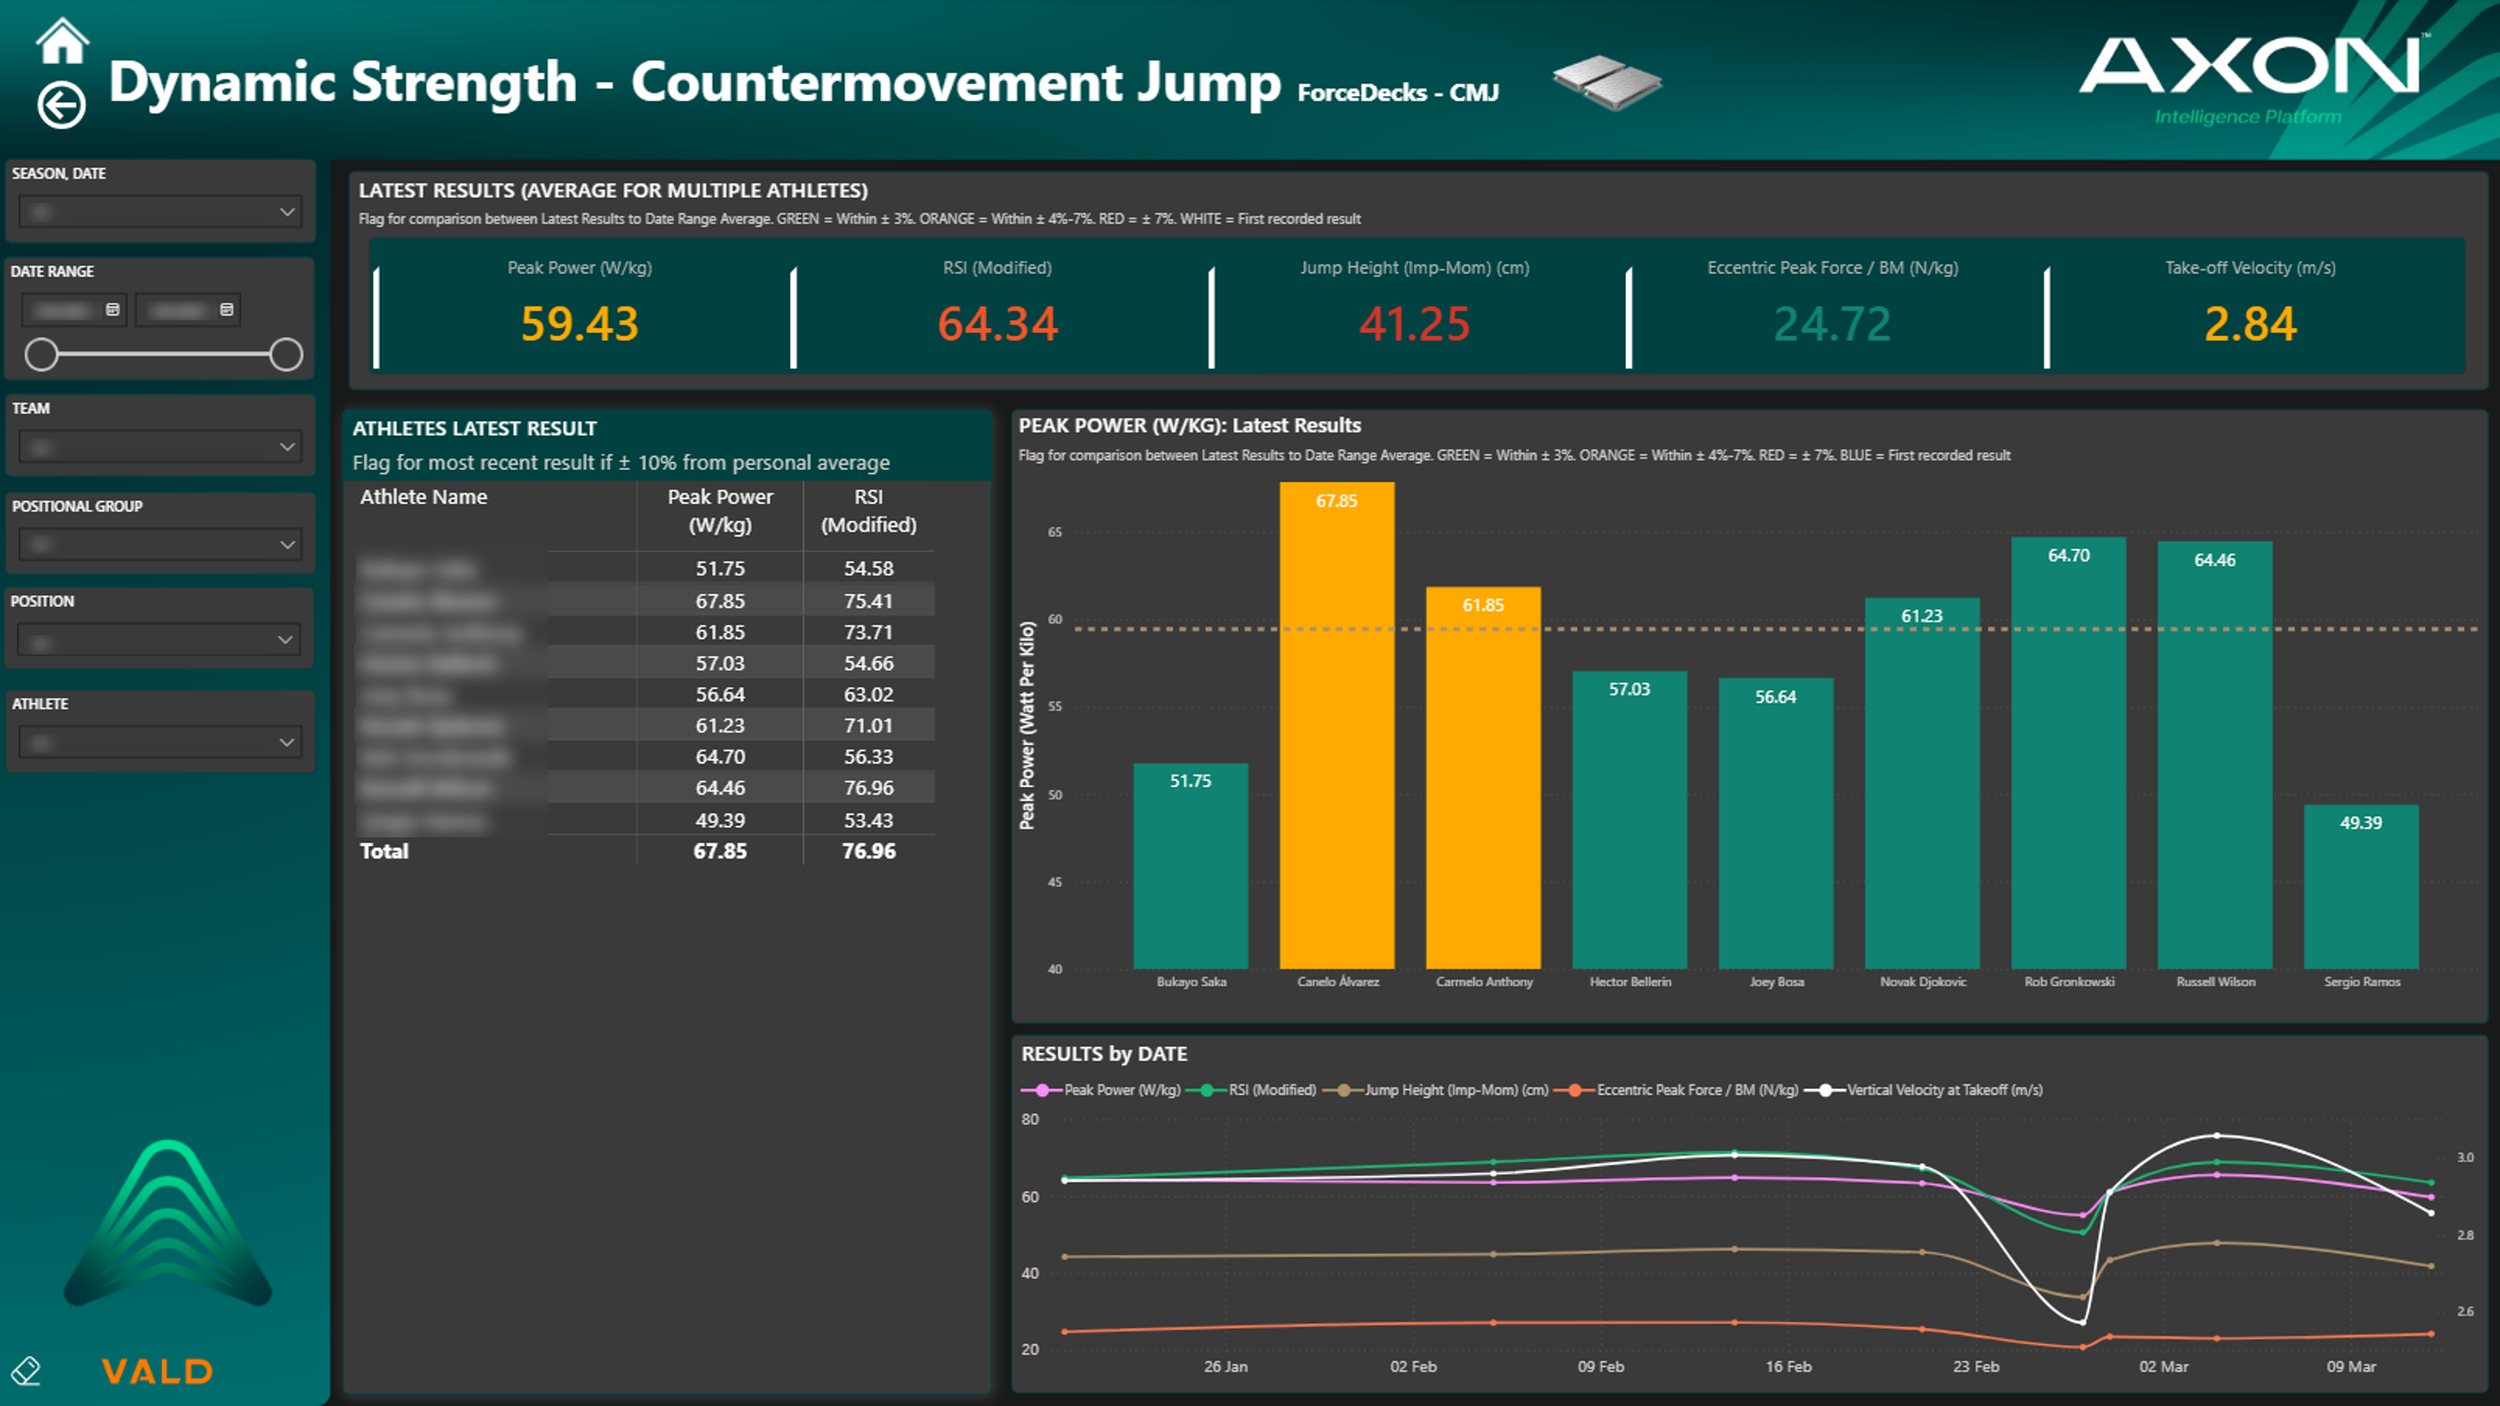
VALD & Strength Diagnostics
Make testing data meaningful with trend analysis, benchmarks, and athlete-level context.
FORCE PLATES | SPEED GATES | DYNAMO | NORDBOARD
-
![]()
Recruitment & Scouting
Compare players, identify profiles, and benchmark performance using consistent, objective data for both Rugby and Football
TARGET PROFILES | ROLE BENCHMARKS | PLAYER COMPARISON
-
![]()
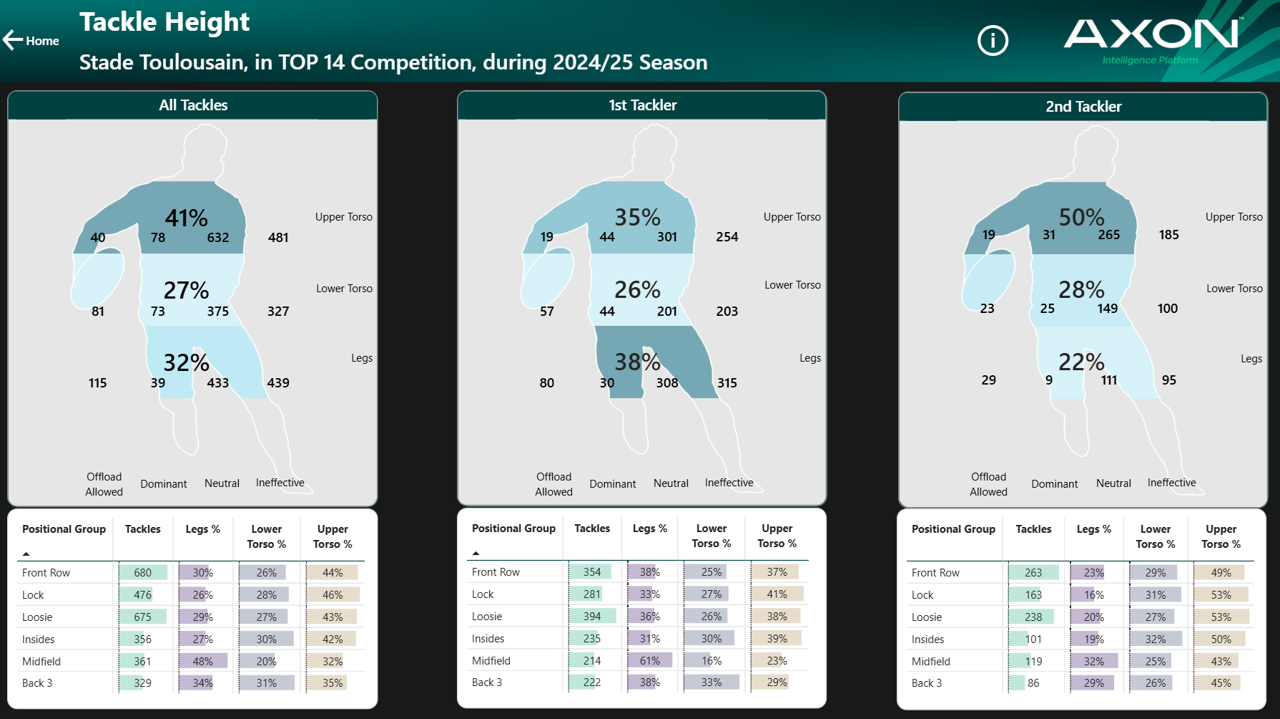
Rugby Performance
Connect match actions, contacts, GPS, and set-piece data to support selection, tactics, and development.
MATCH ANALYSIS | TRENDS | ROLE-BASED KPIs
-
![]()
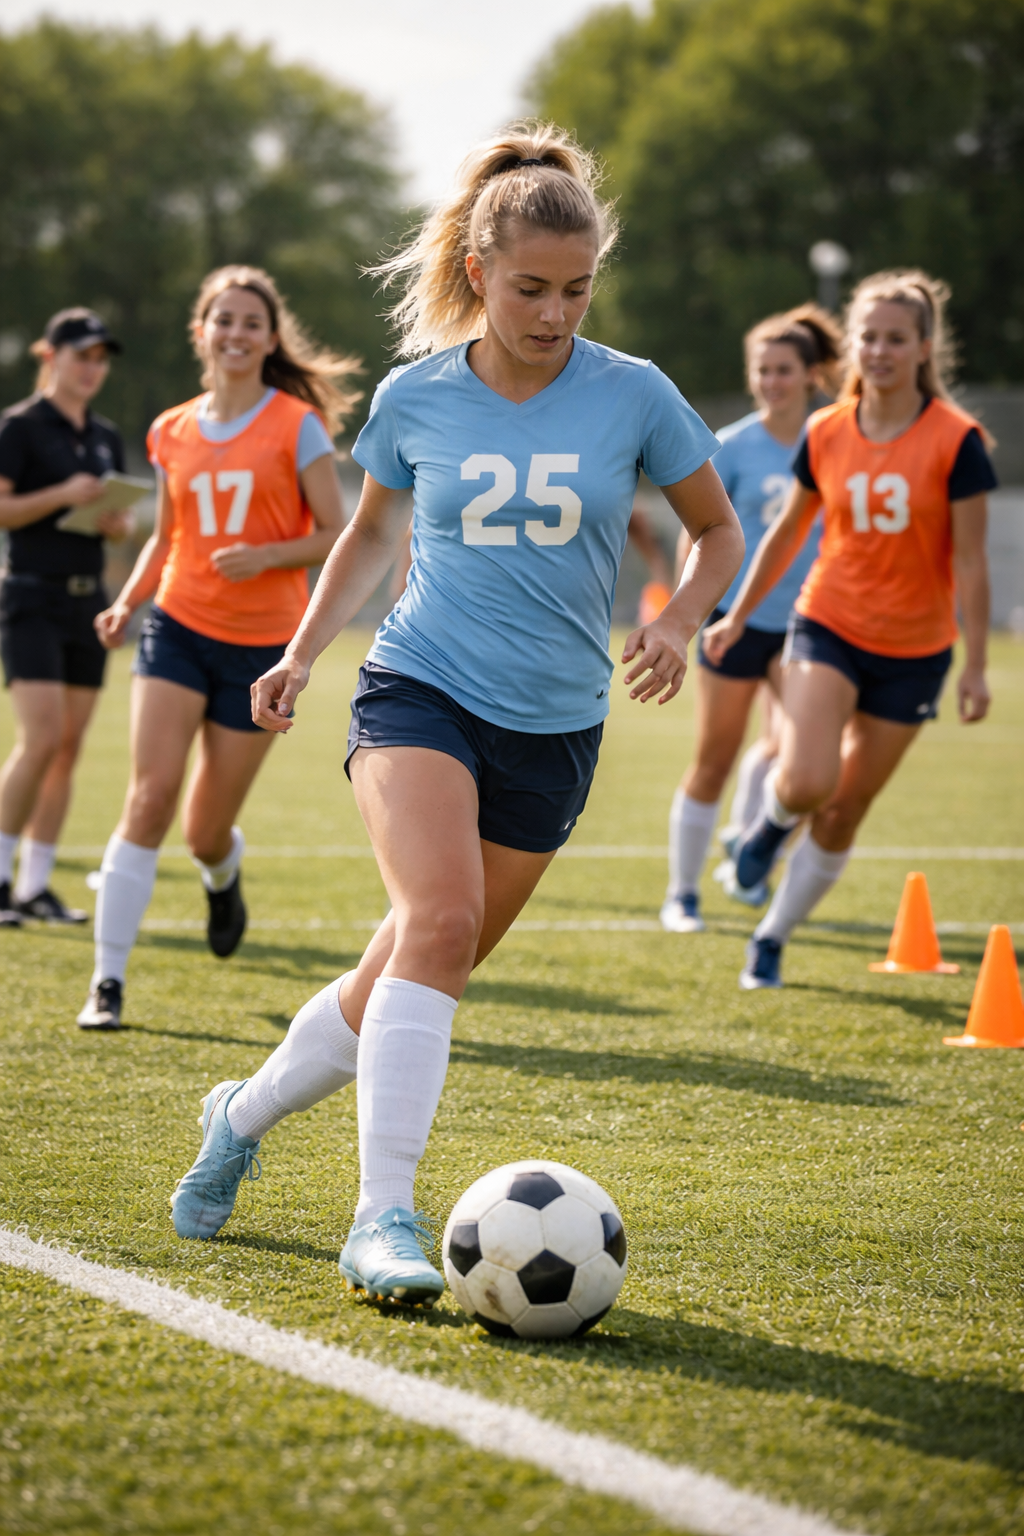
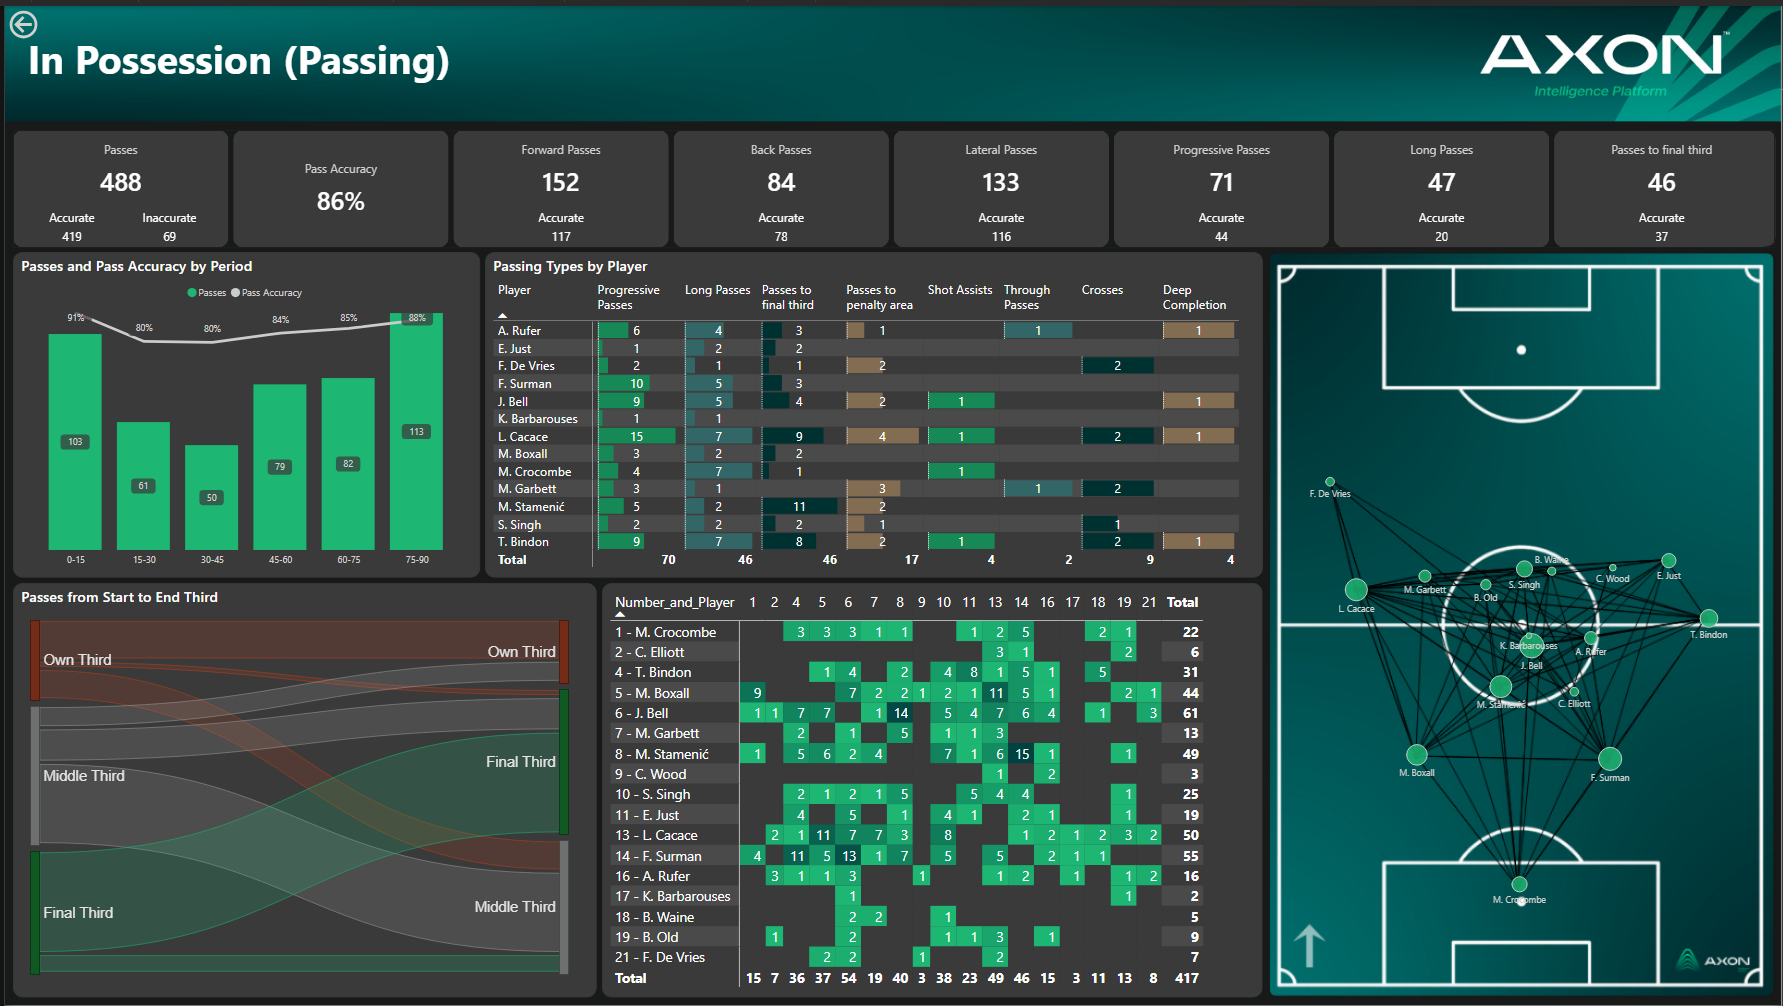
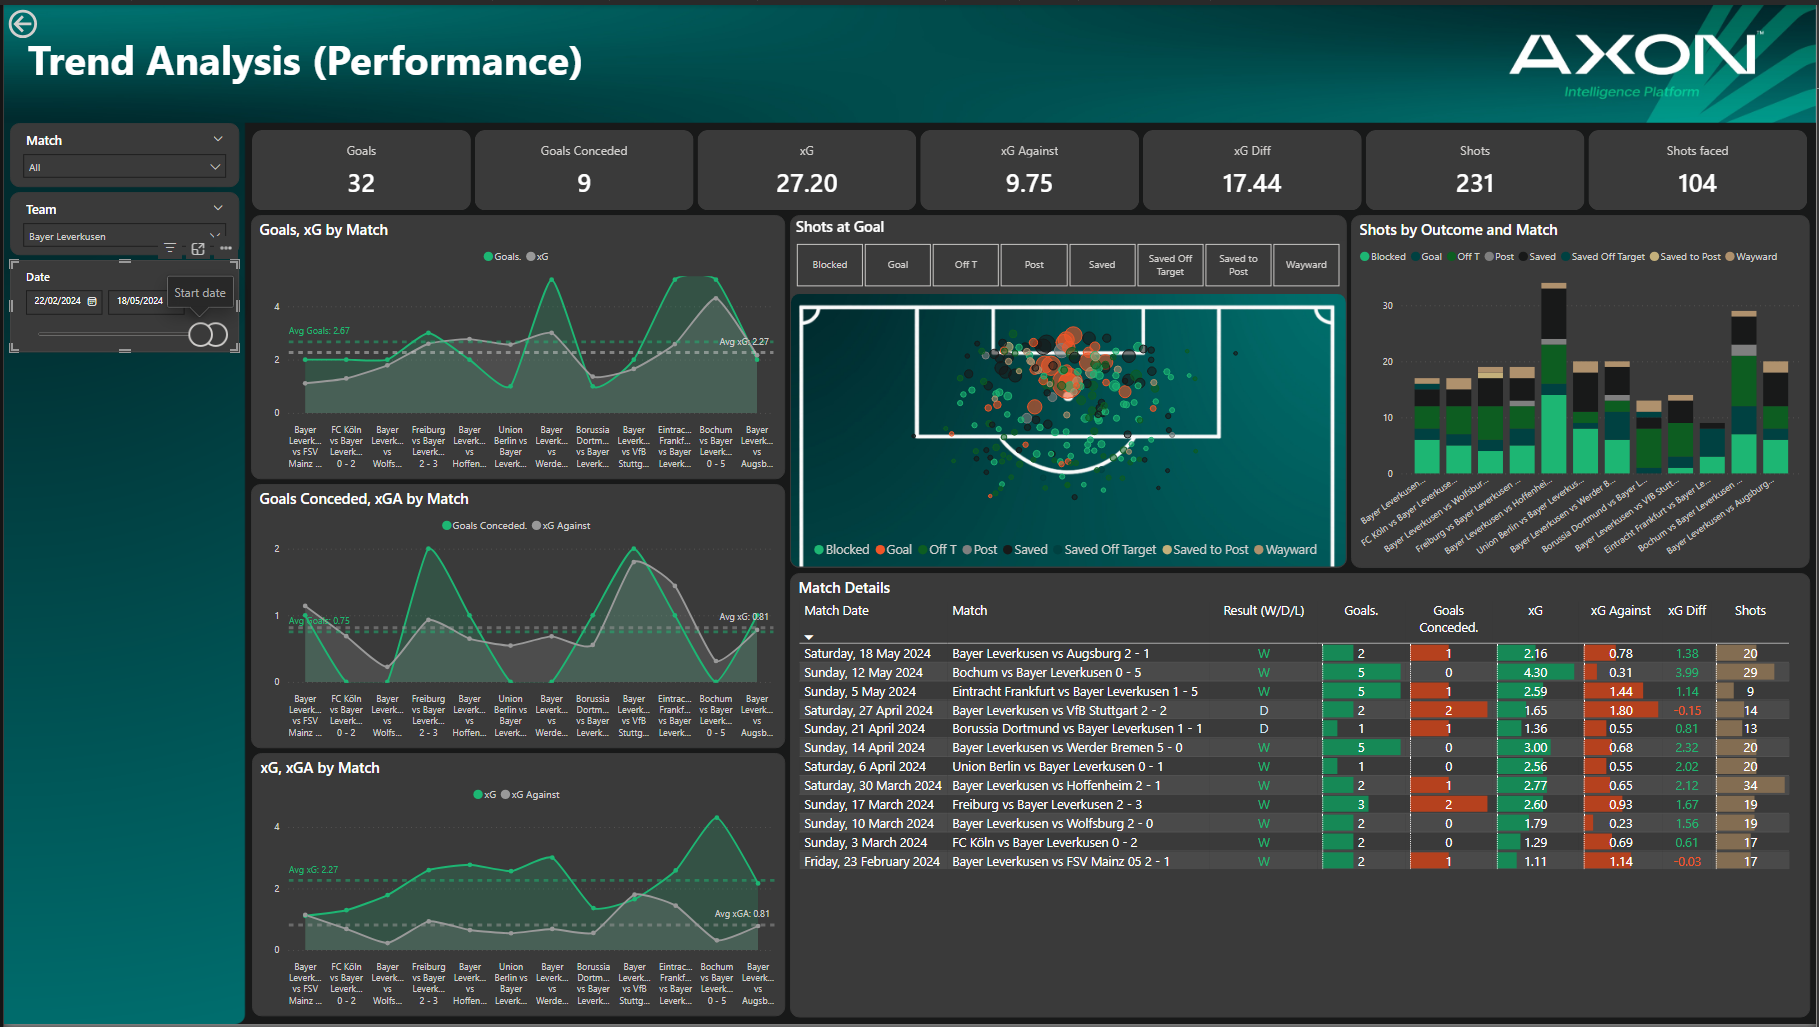
Football Performance
Unify match data, physical output, and tactical context into coach-ready insight.
MATCH ANALYSIS | TRENDS | PLAYER ROLES


GPS Performance
Understand physical output, work rate, and load in context.
Axon’s GPS templates transform raw tracking data into clear insight across sessions, matches, positions, and individuals.
What Teams Use This For
Monitoring training and match load
Comparing positional demands
Identifying trends and risk signals
Supporting return-to-play decisions


VALD & Strength Diagnostics
Turn testing data into meaningful performance signals.
Axon’s VALD templates connect force plate and strength data to athlete profiles, benchmarks, and trends making testing actionable, not just reportable.
What Teams Use This For
Comparing athletes to positional or squad benchmarks
Supporting rehab and readiness decisions
Aligning medical, S&C, and coaching conversations


Rugby Performance Analysis
See the full picture of rugby performance, not isolated stats.
Axon’s rugby templates combine match actions, GPS, contact data, and set-piece involvement to support selection, tactical planning, and player development.
What Teams Use This For
Opposition previews and reviews
Work rate and contact analysis
Set piece and phase involvement
Role-specific player KPIs


Football Performance Analysis
Turn football data into insight coaches and players understand.
Axon’s football templates unify match data, physical outputs, and tactical context to support faster reviews and clearer decision-making.
What Teams Use This For
Match and opposition analysis
Positional and role-based KPIs
Physical output in tactical context
Player benchmarking and development

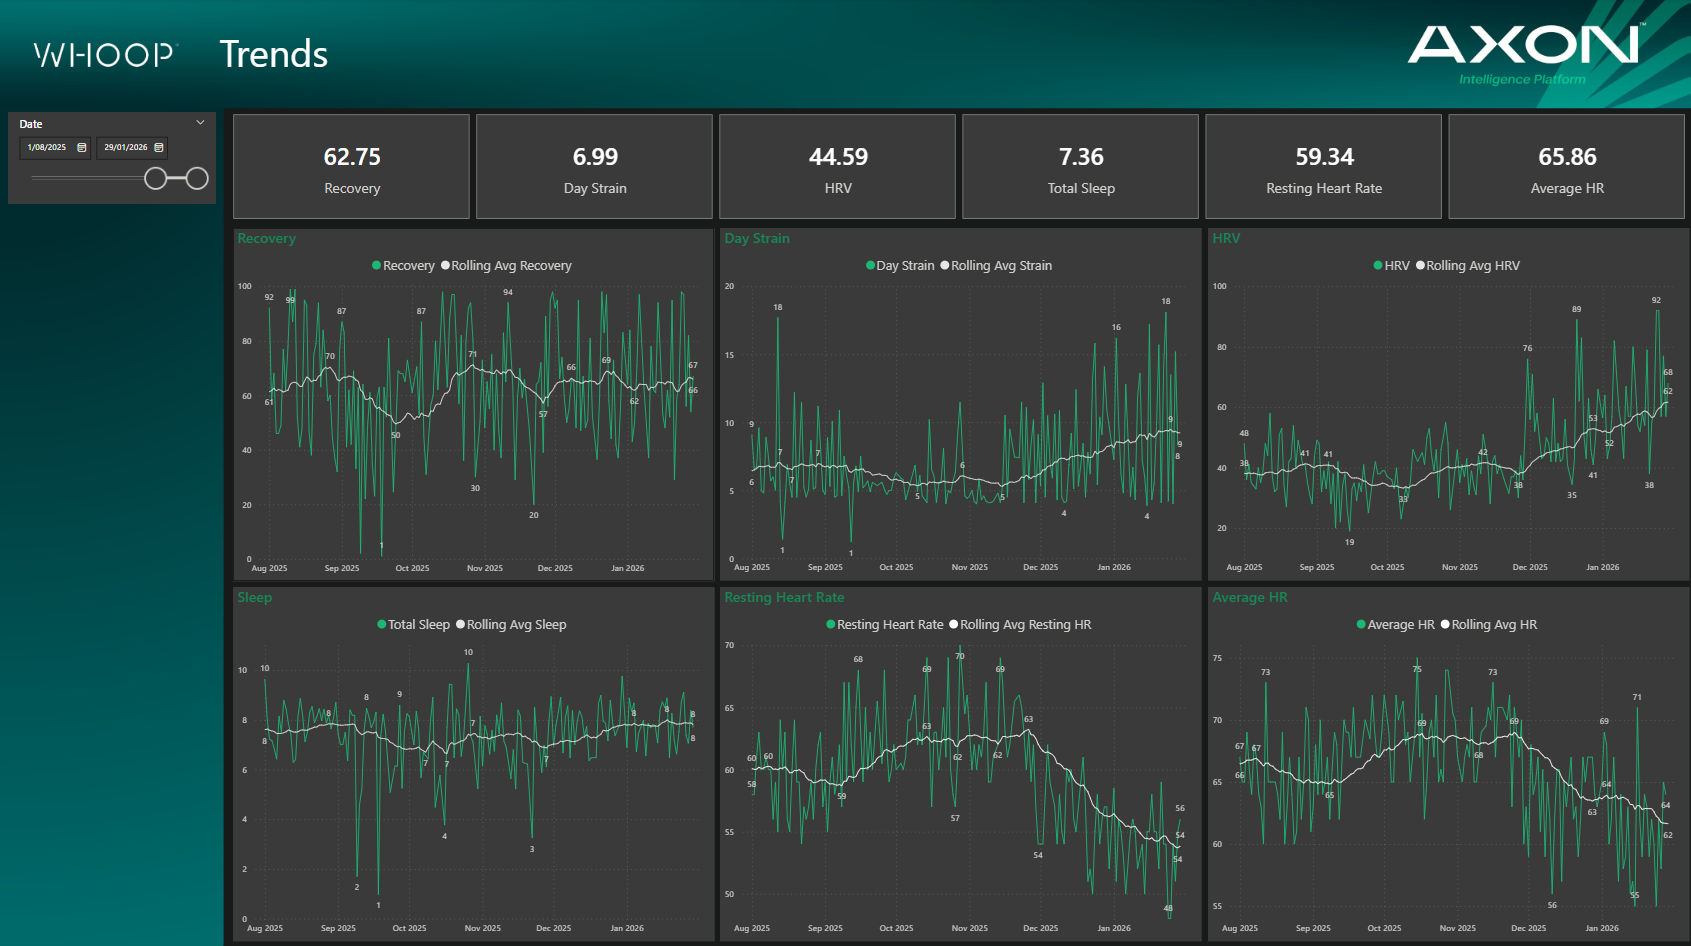
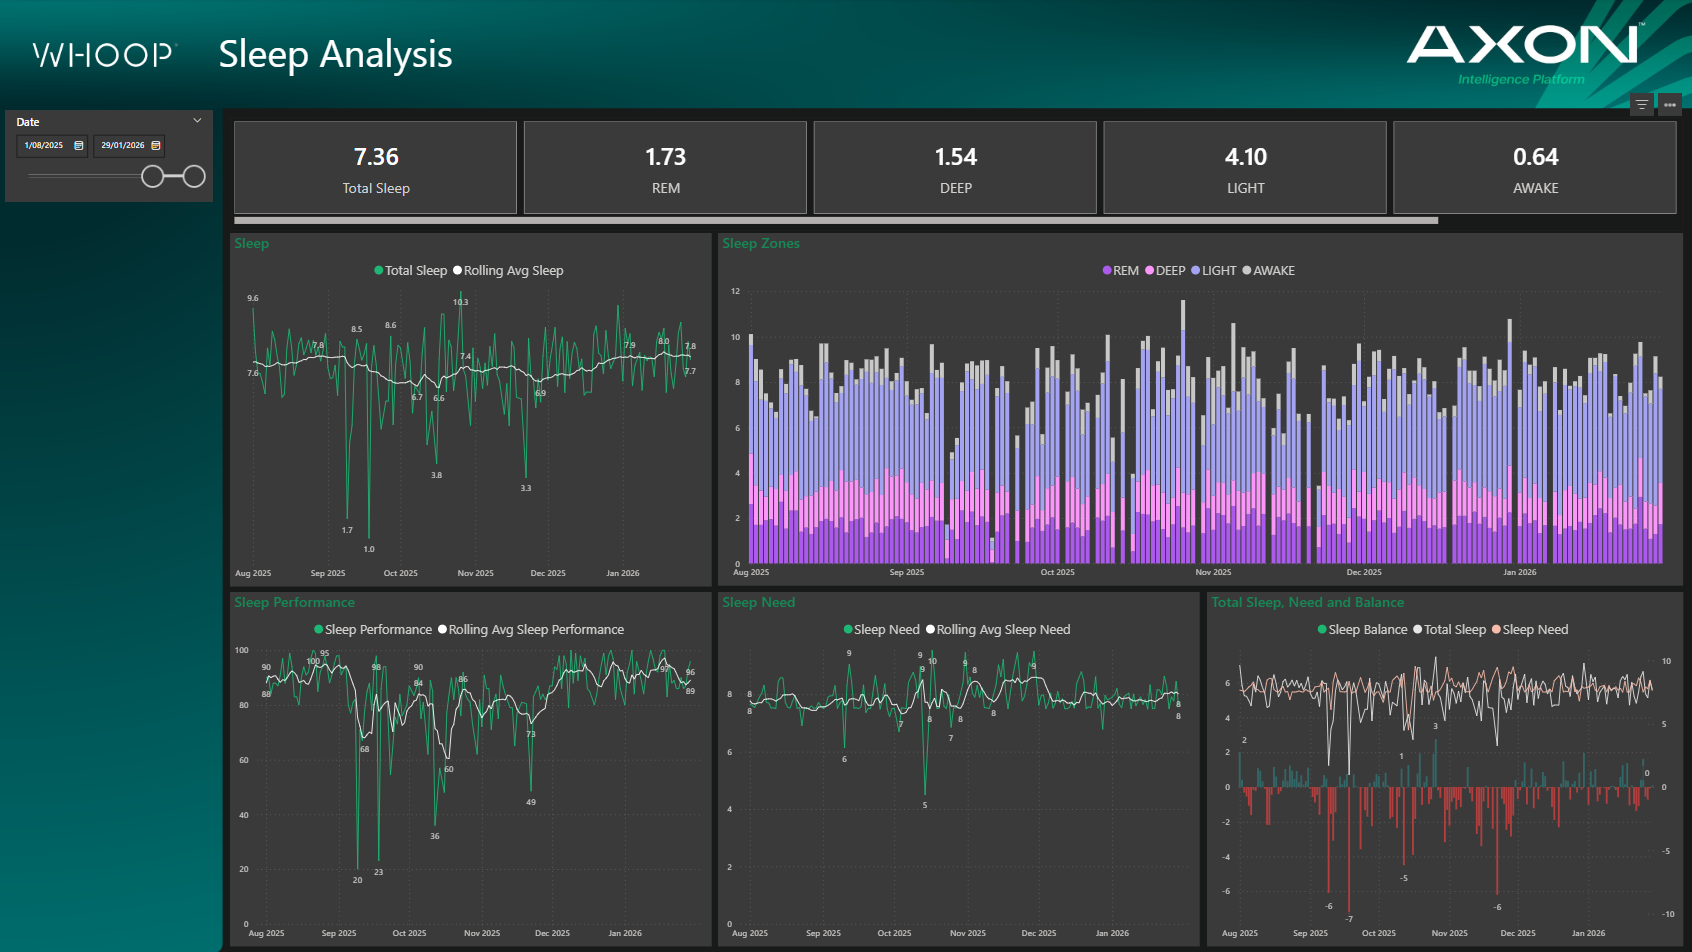
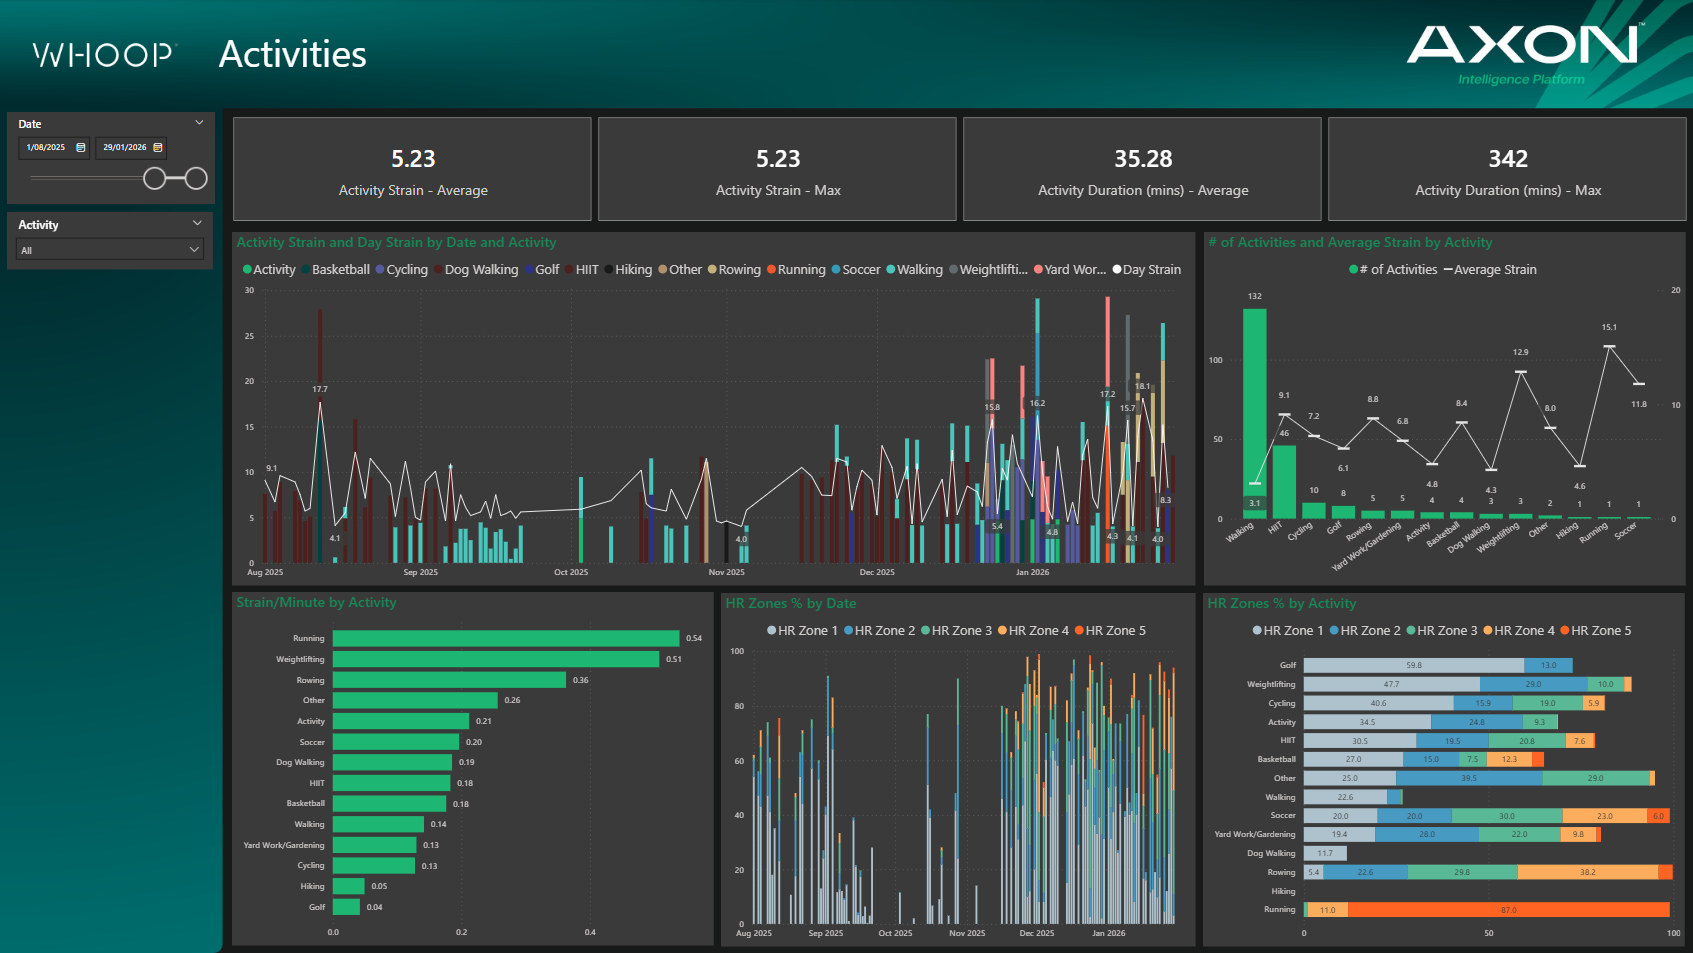
Wearables Data Analysis
Align daily signals with performance goals, readiness and decision timelines.
Axon brings wearable data into the same connected performance picture as training load, match output, wellness, and diagnostics.
What Teams Use This For
Tracking load, fatigue and readiness
Understanding trends across training & matches
Aligning wearable data with other performance signals
Giving staff a shared view of athlete status
Built To Adapt To Your Environment
Every Axon template is fully customisable. Teams can:

Edit and define their own KPIs

Adapt templates to their game model

Combine templates across disciplines

Evolve reporting as performance questions change