Turn Connected Data Into Clear, Shared Understanding
Once performance information is connected, the next challenge is knowing what to focus on.
Axon is designed to help teams move quickly from information to insight, so conversations are grounded in what actually matters.
Built Around Real Performance Questions
Sports teams don’t need more reports. They need answers. Axon supports reporting that starts with real questions, such as:
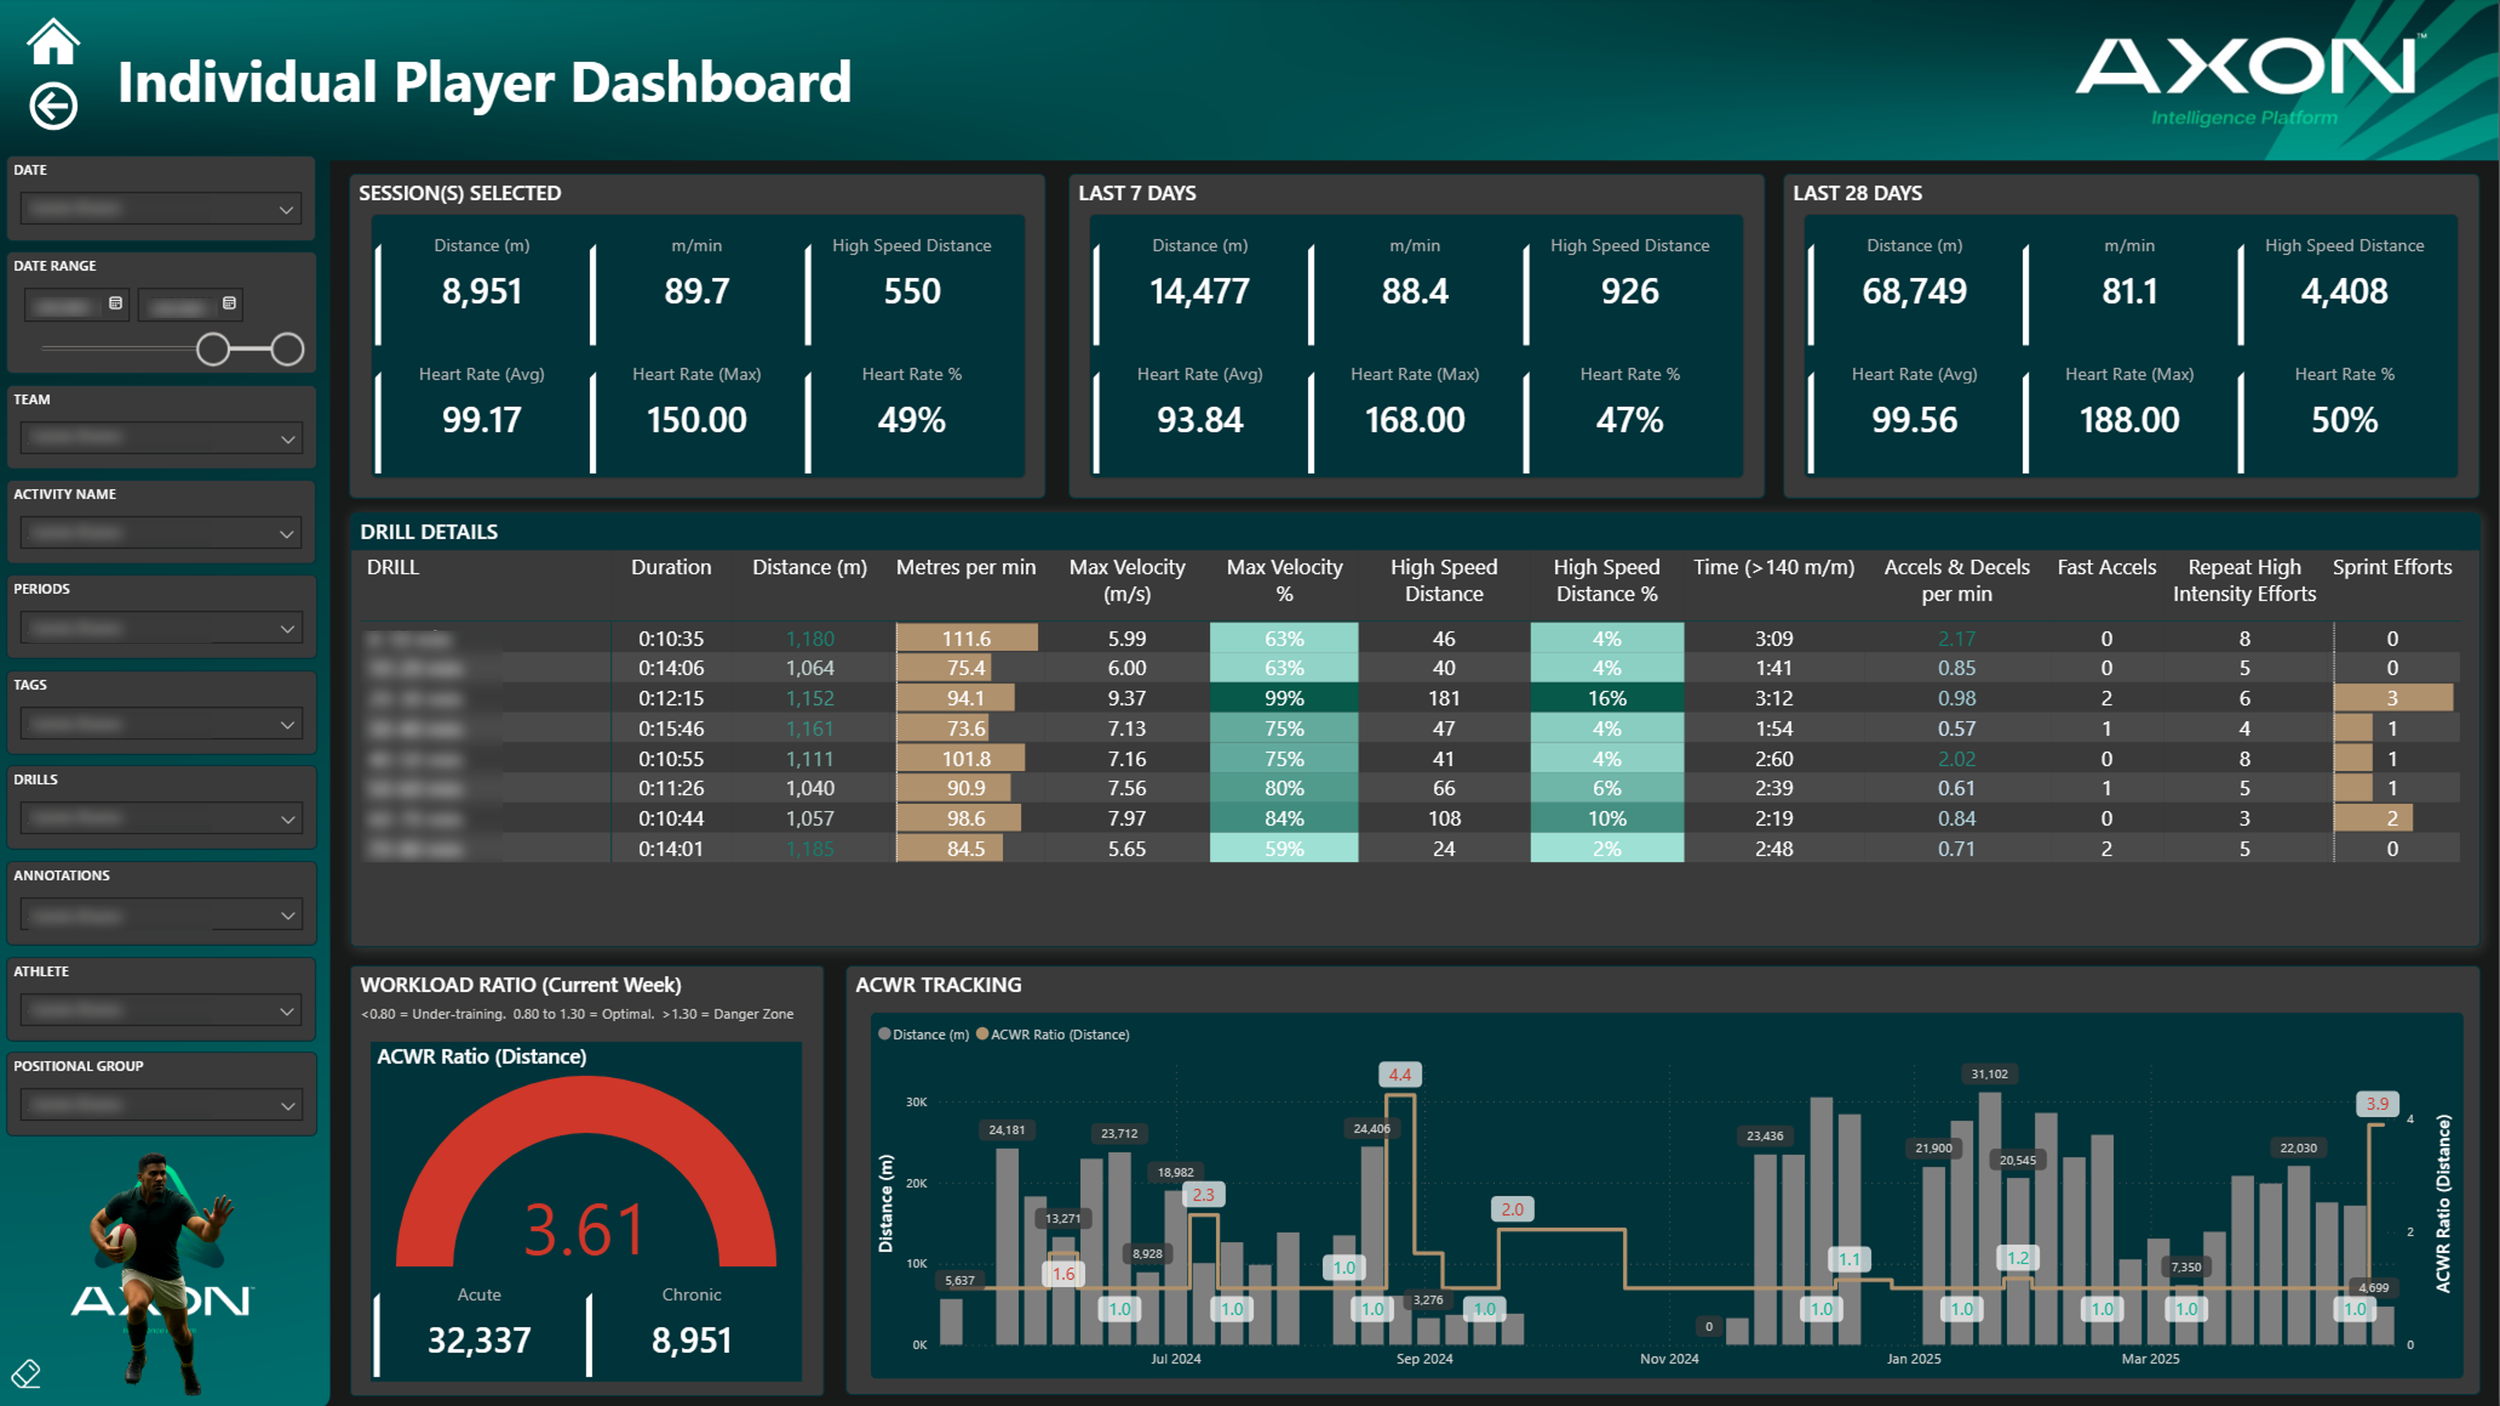
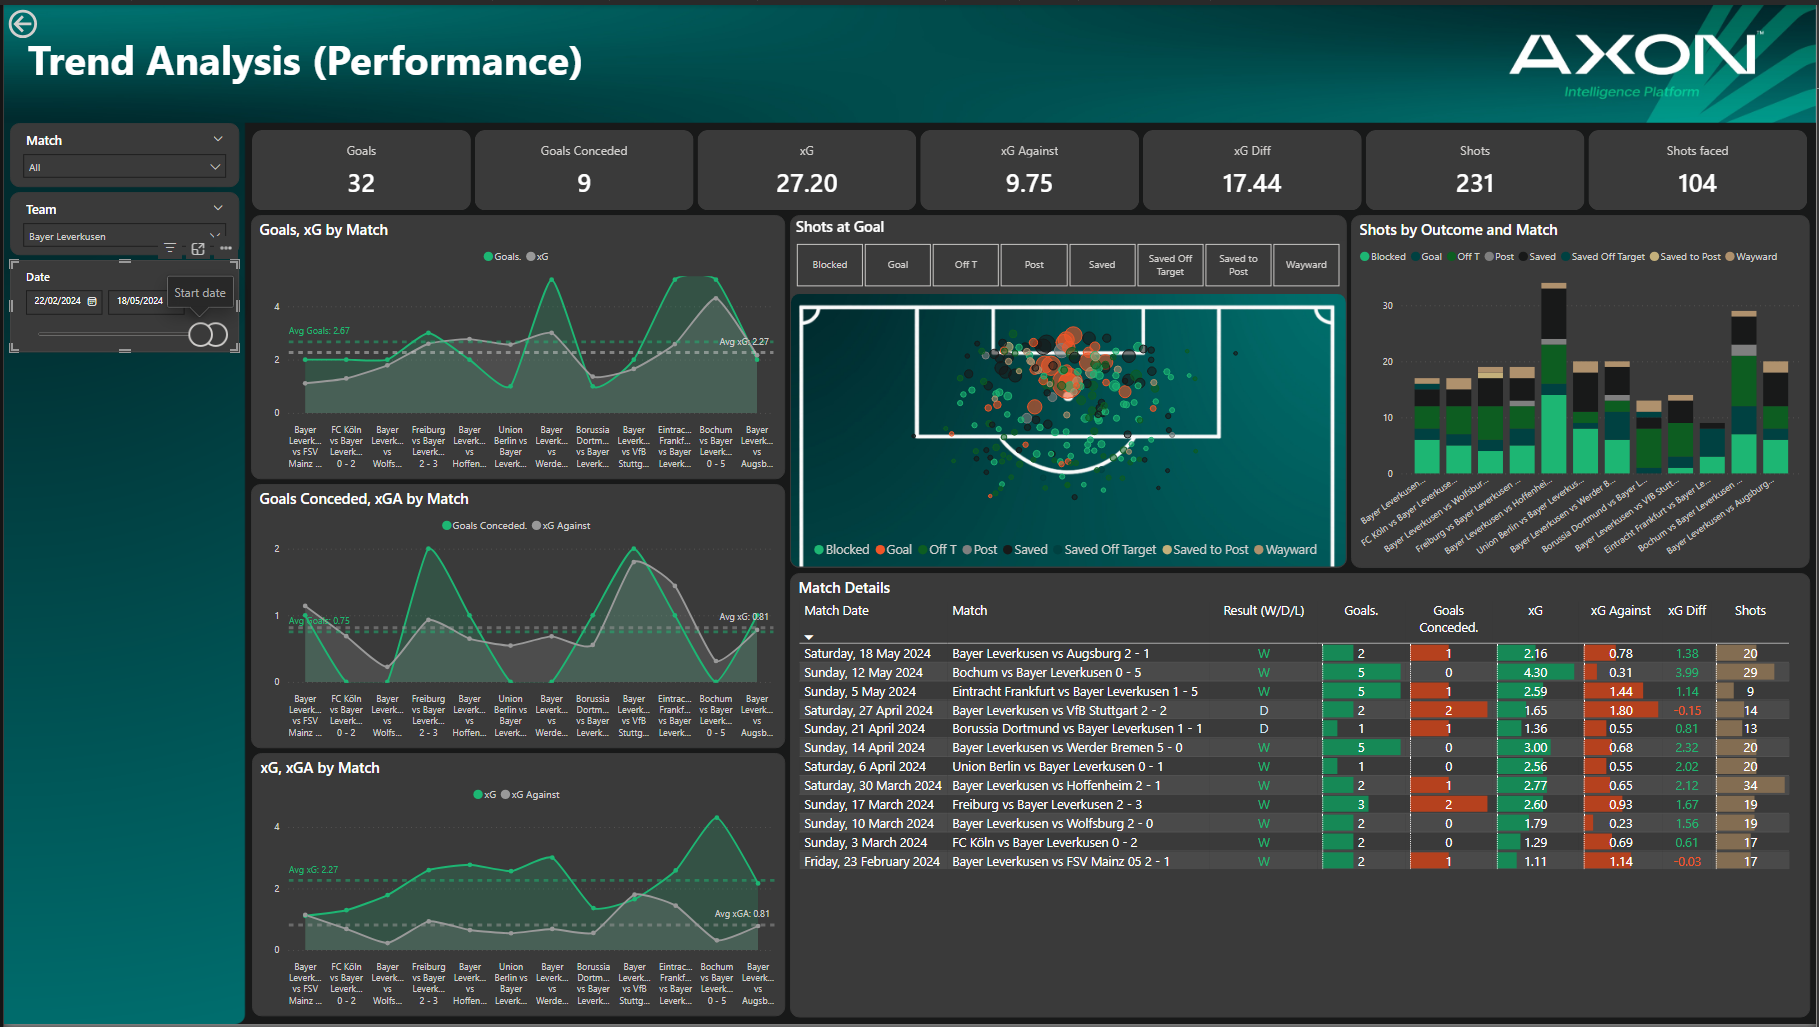
How are players responding to load over time?
Where is risk emerging?
What has changed since last week?
What needs attention today?
Reports in Axon are designed to surface these answers clearly without requiring teams to rebuild the same views again and again.
Proven Templates For When Speed Matters
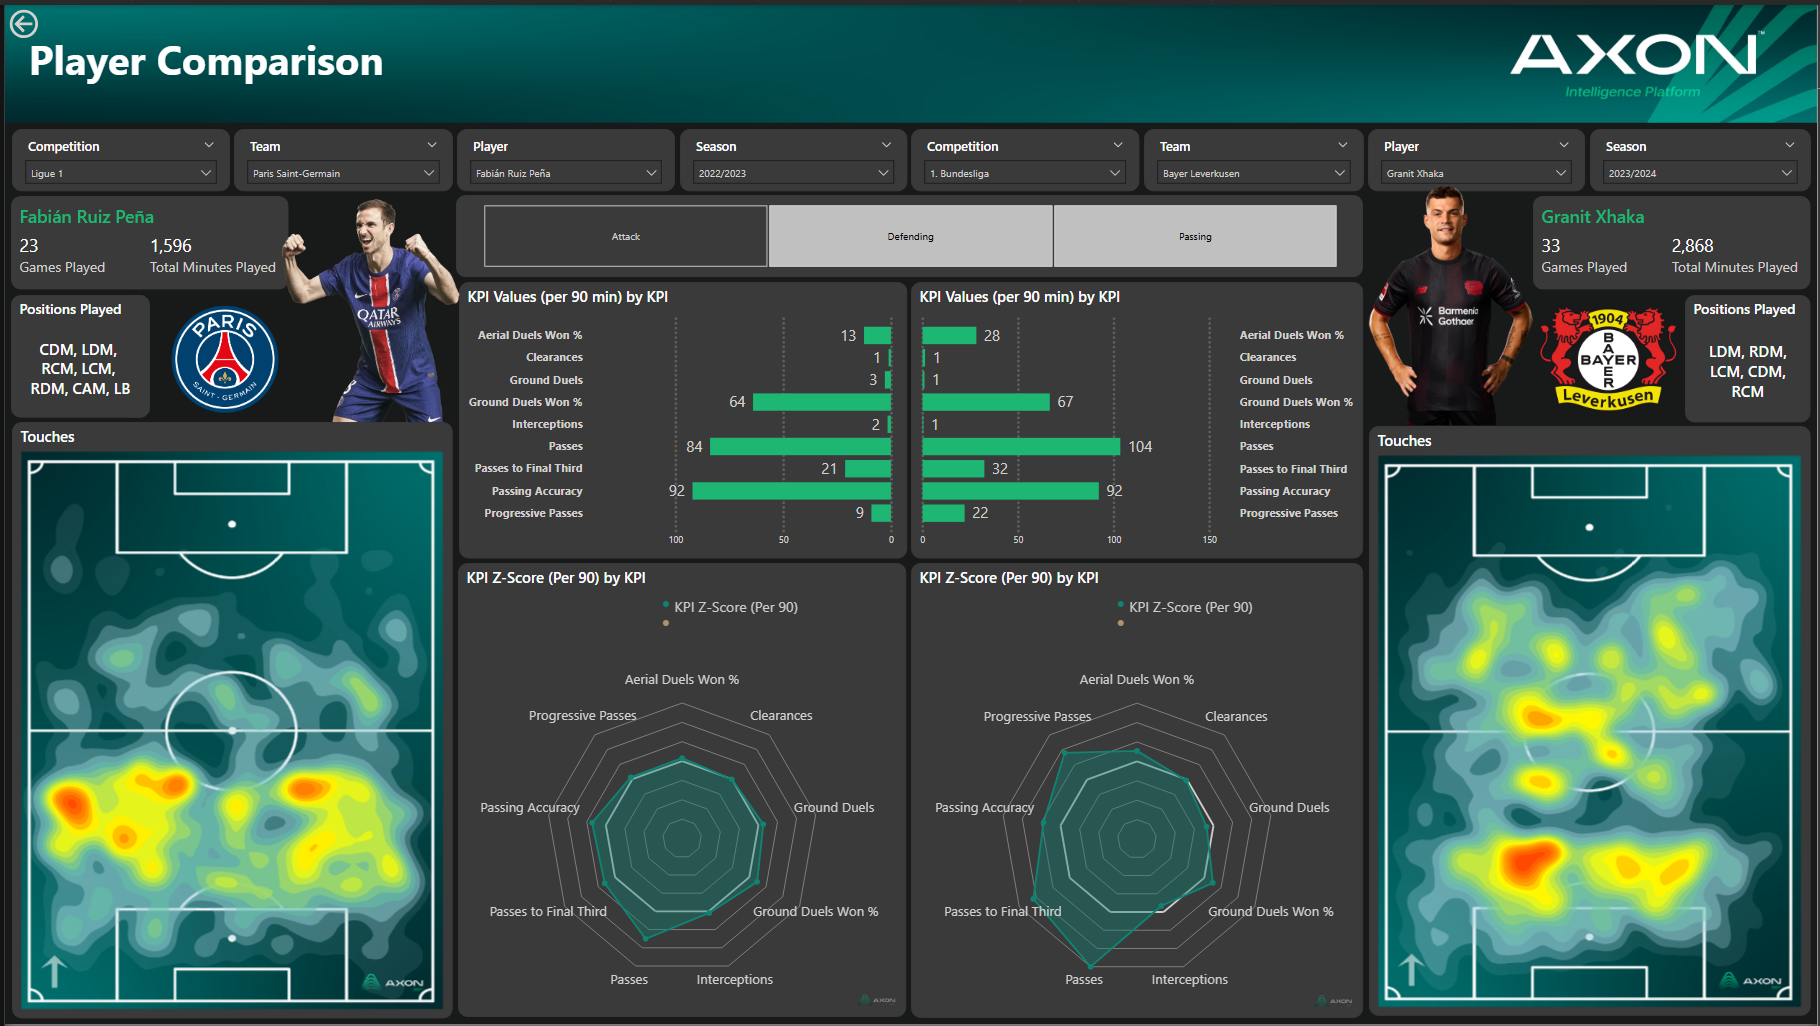


Context, Not Just Numbers
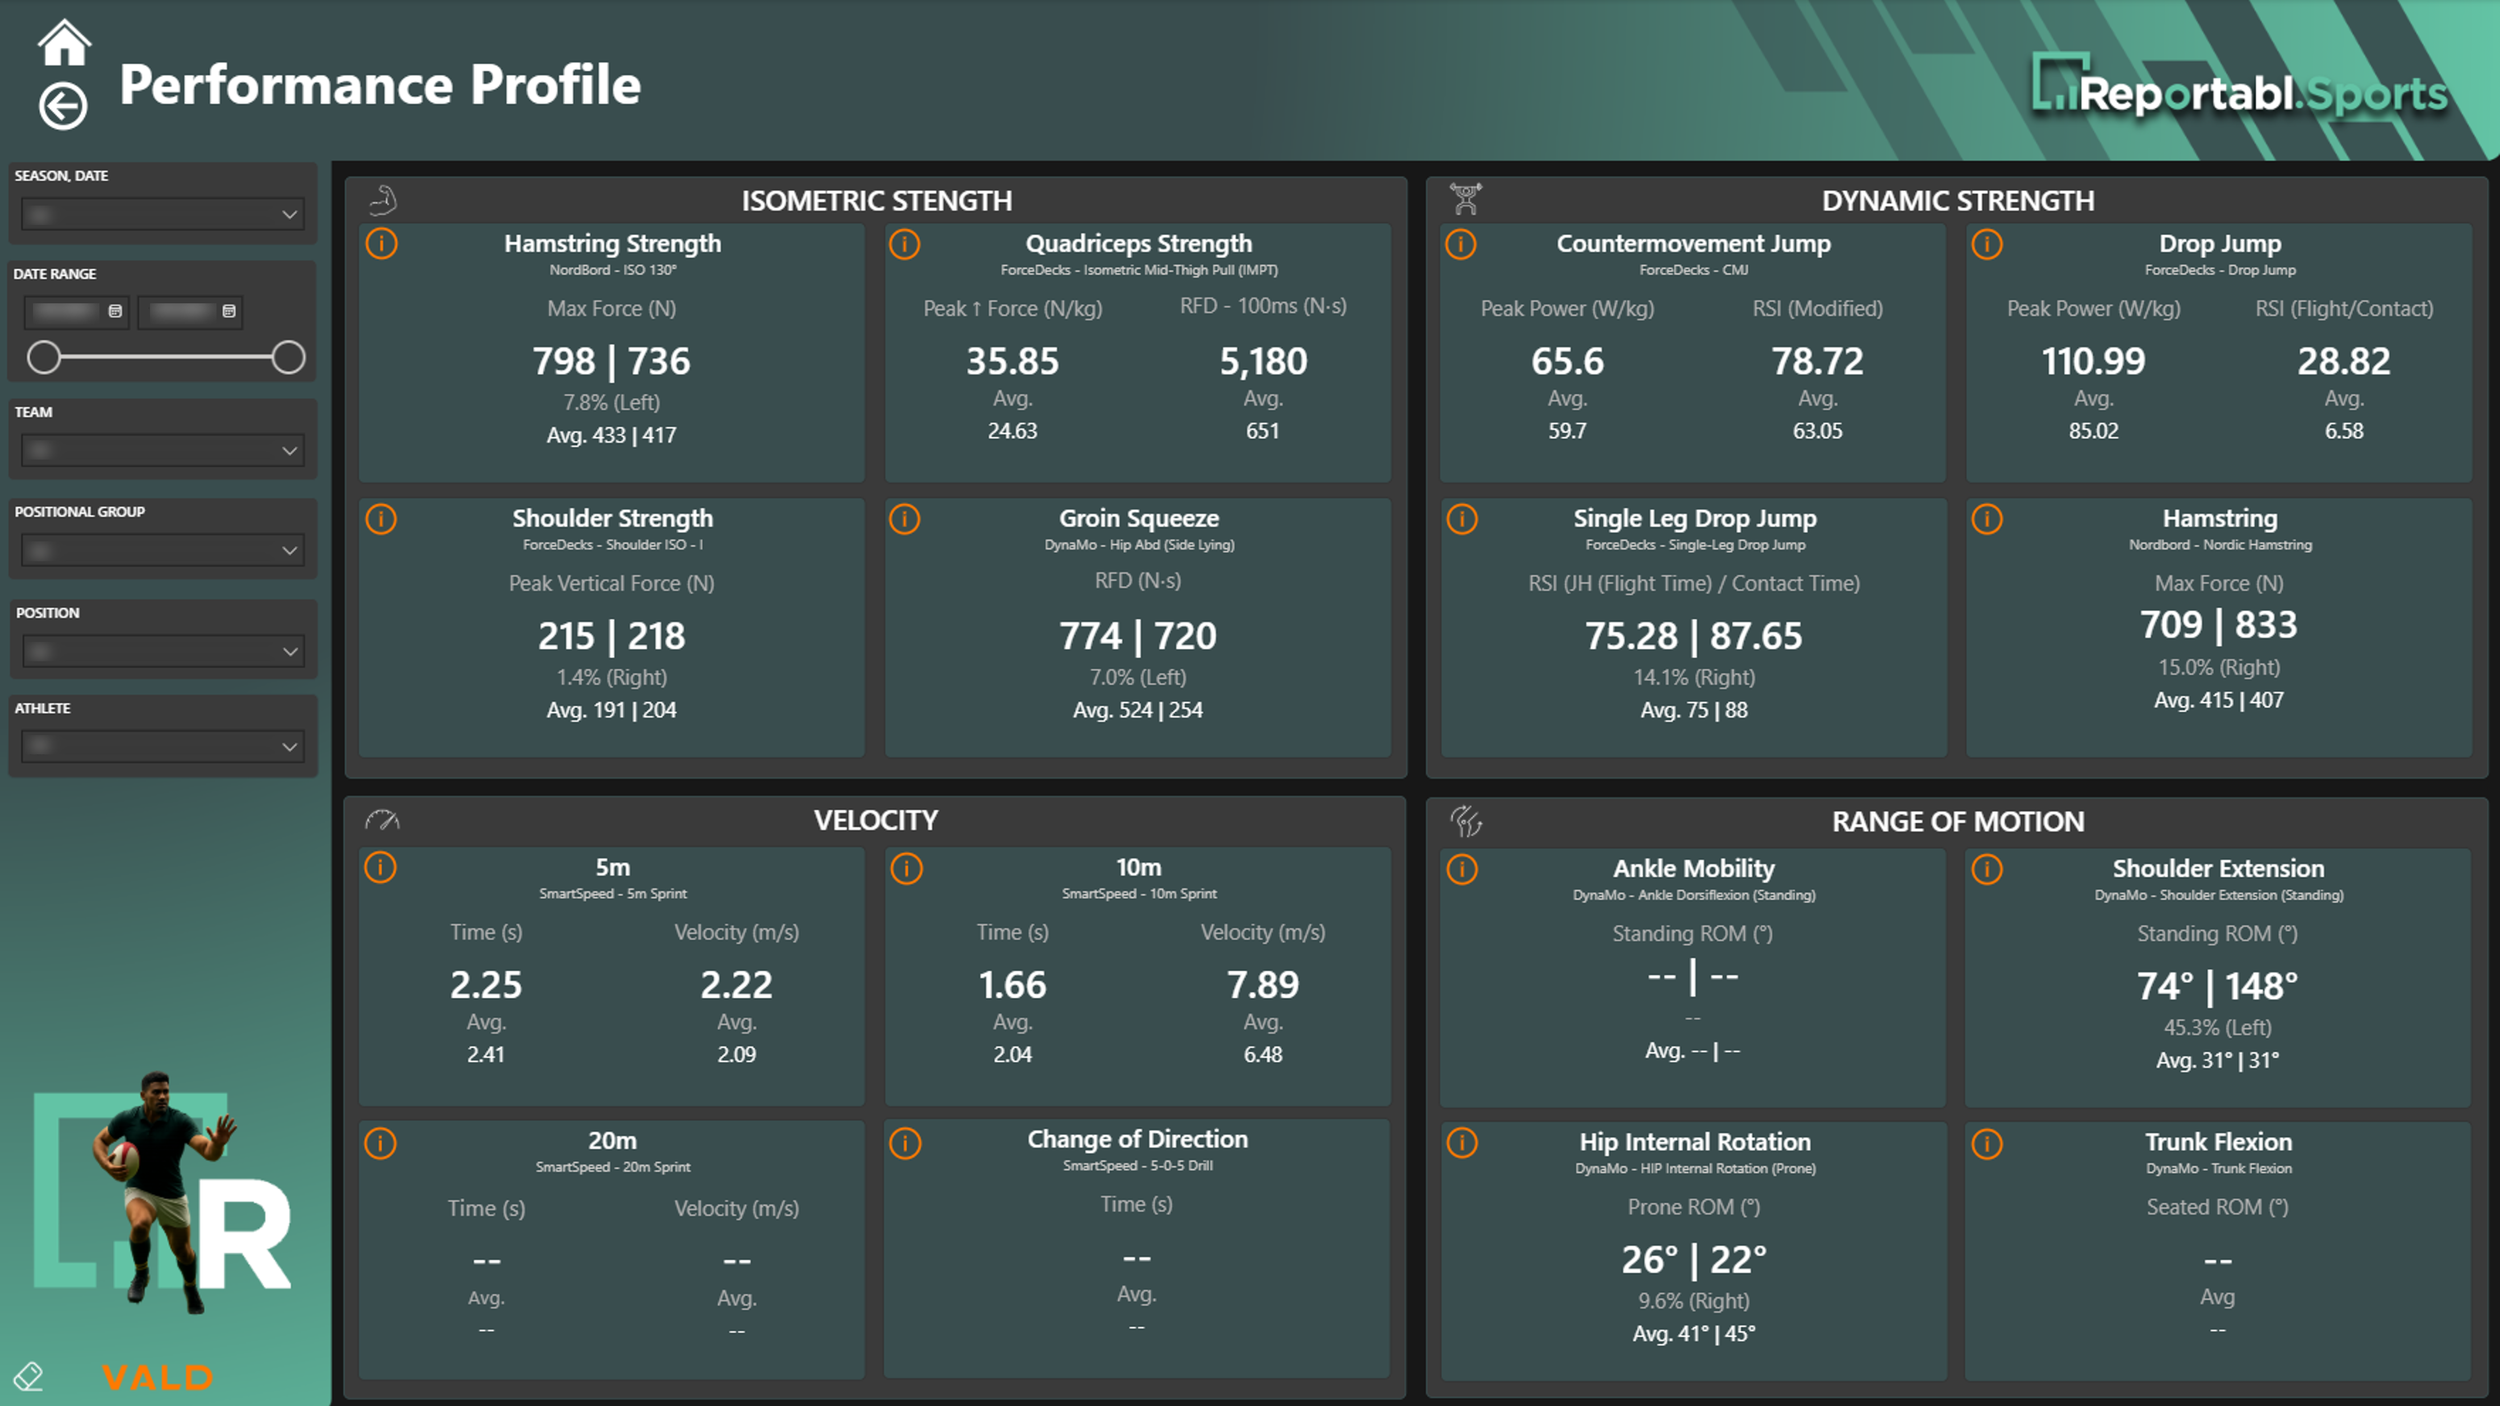
Axon brings multiple layers of context together so you don’t just see what is happening, but understand why it matters.
Performance data is viewed alongside trends, history, workload, availability, and staff insight creating a shared understanding across roles.
Flexible Reporting When Questions Evolve
No two programs are the same and performance questions change as seasons, staff and priorities evolve. Axon support reporting that evolves with you.
This flexibility ensures reporting stays relevant - not locked into static formats, as questions change over time.

Reduce Admin and Increase Alignment
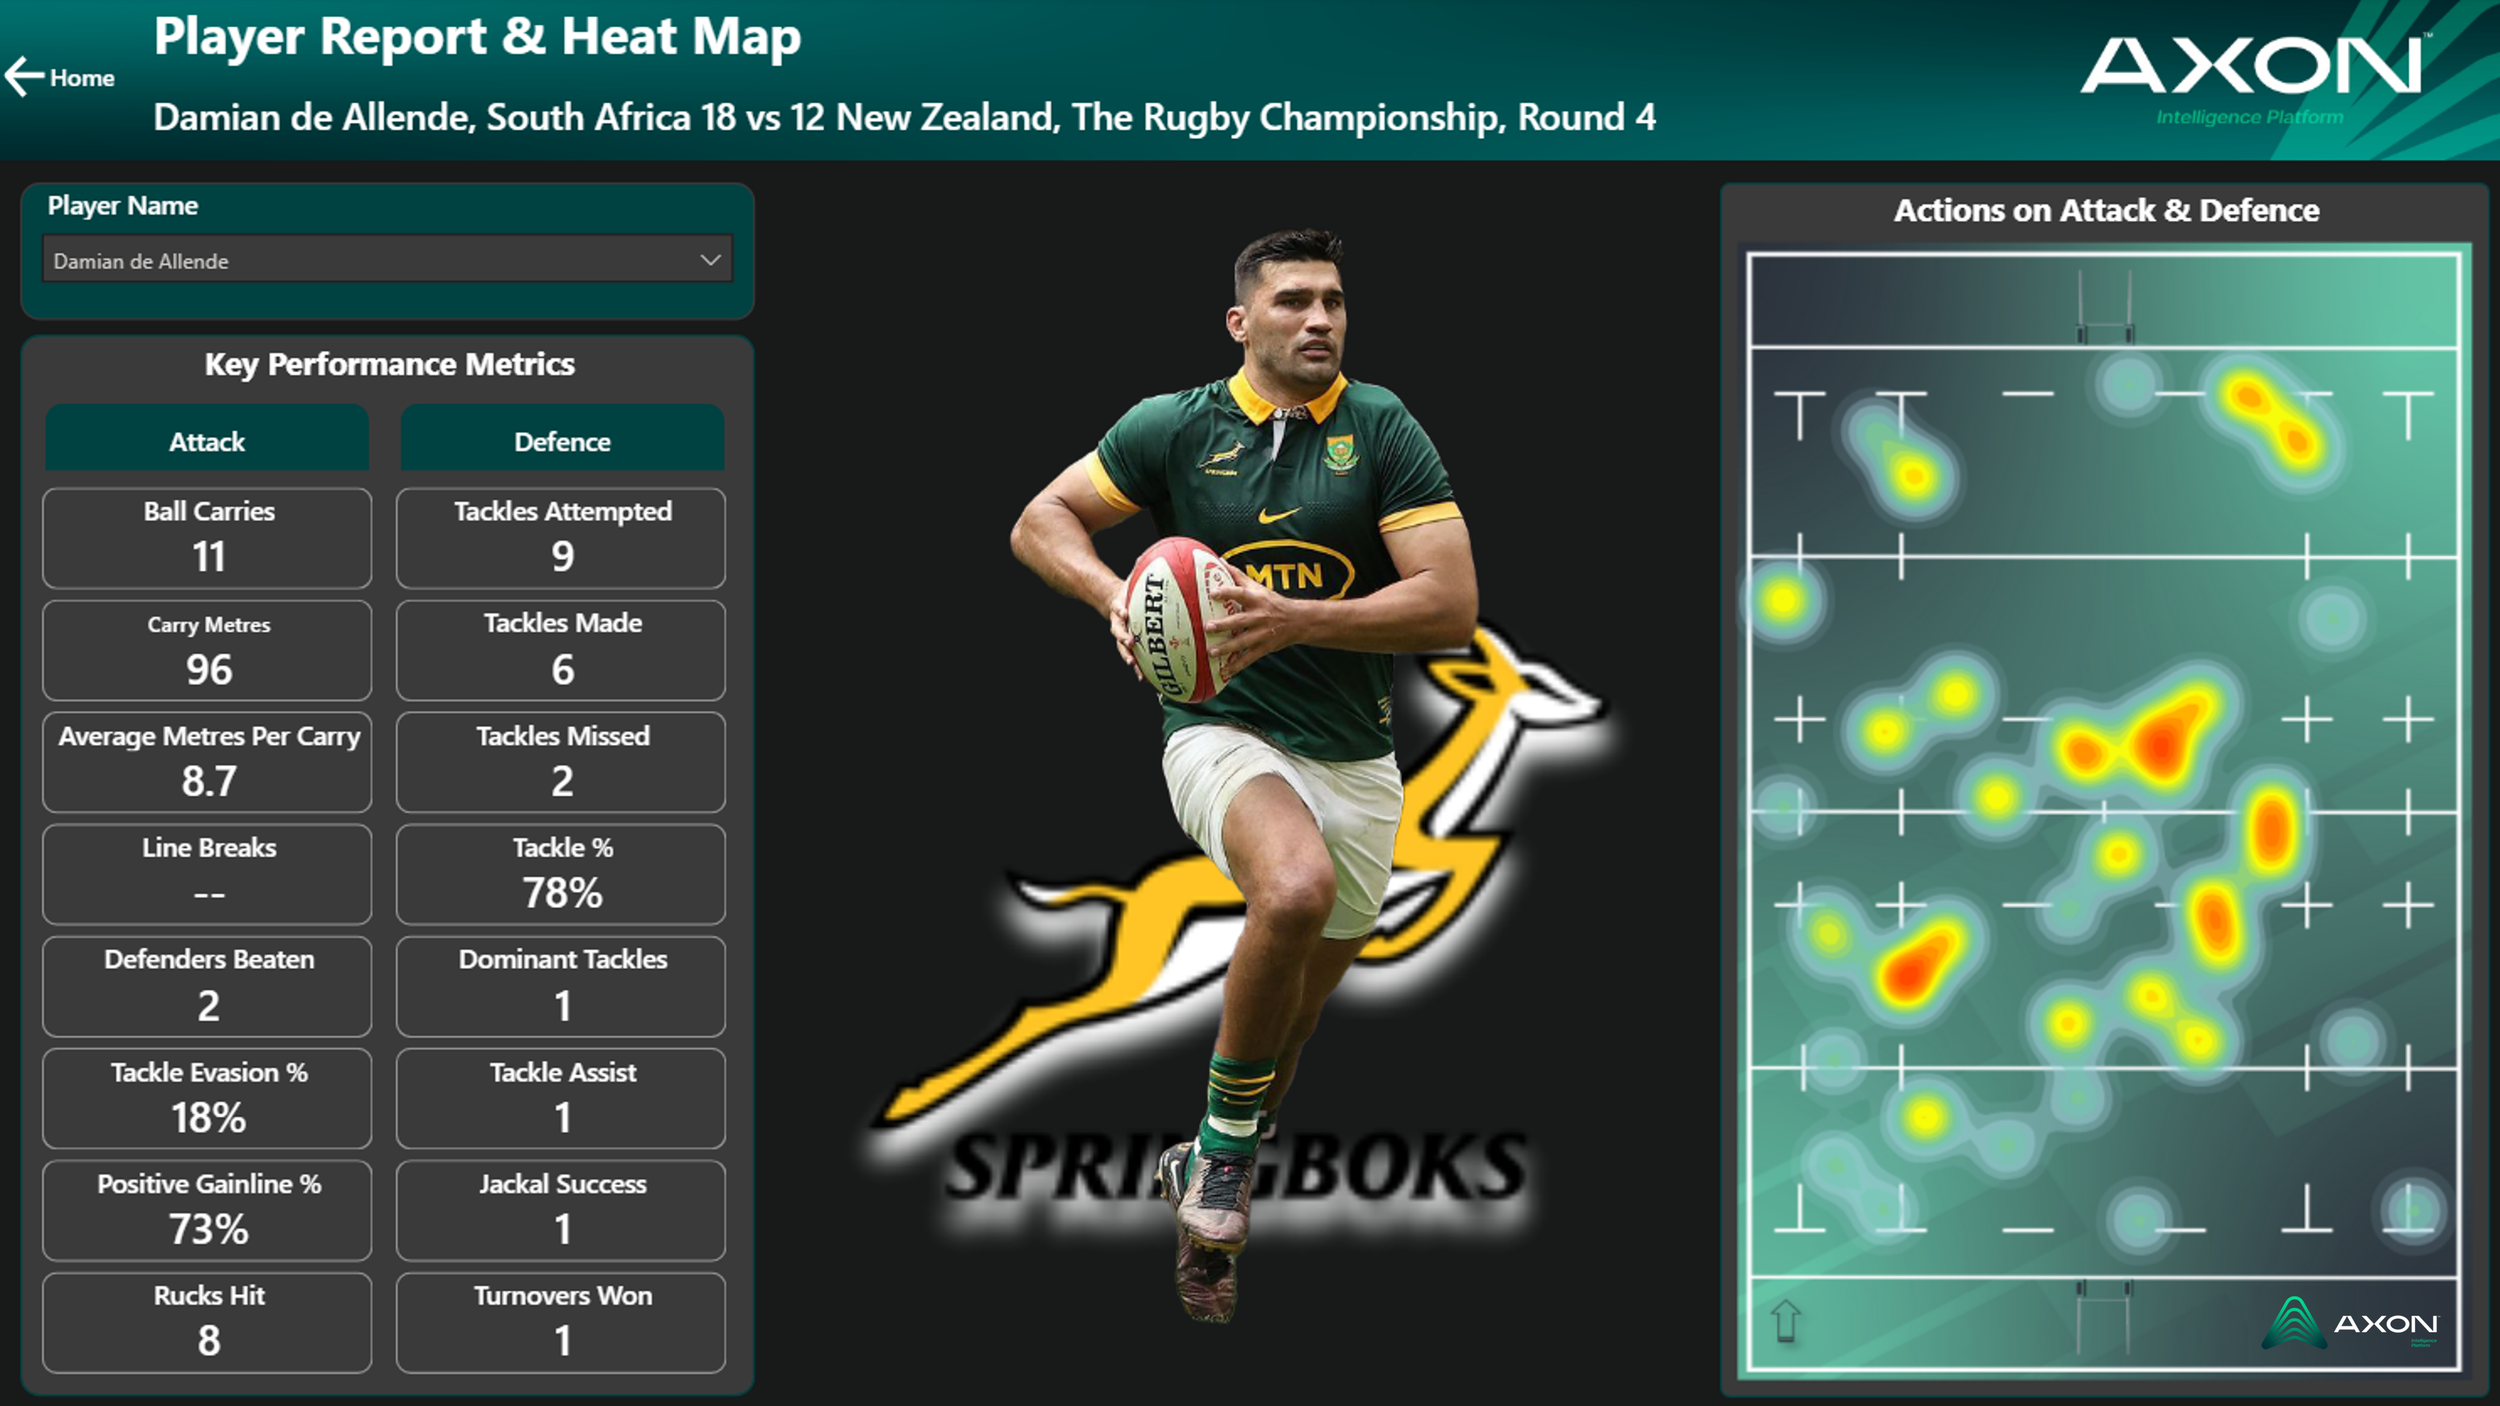
Bring multiple layers of context together so you don’t just see what is happening, but understand why it matters.
Performance data is viewed alongside trends, history, workload, availability, and staff insight creating a shared understanding across roles.
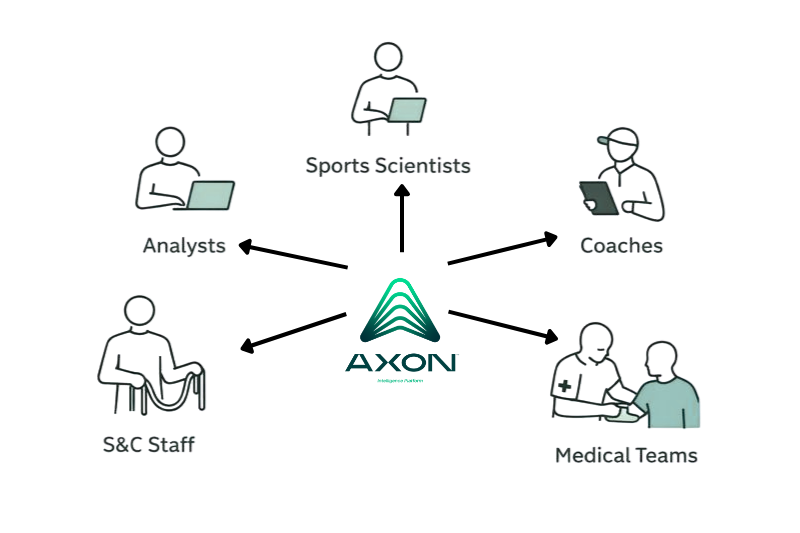
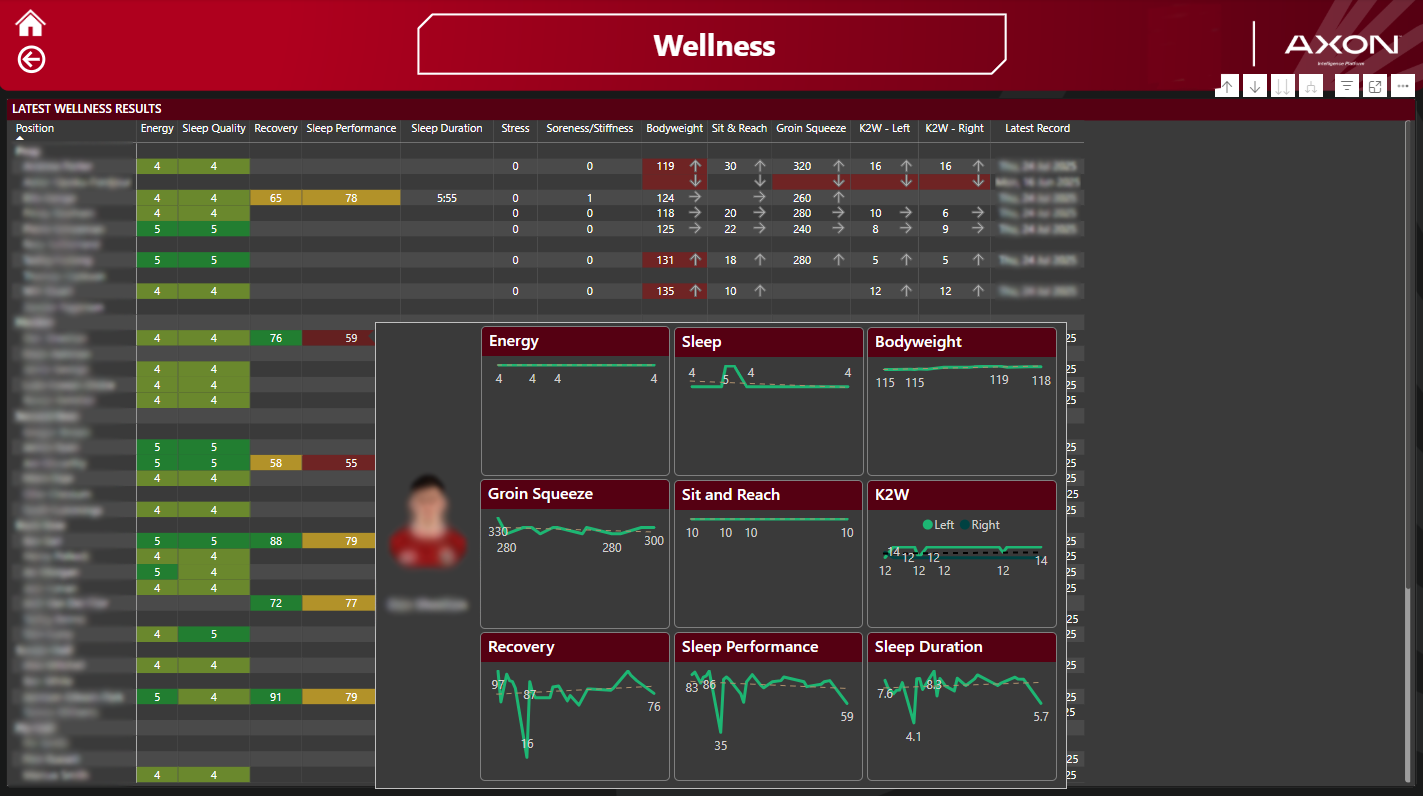
Designed For Shared Use
Reports are built to be used together.
They’re designed to support:
Group discussions
Alignment between departments
Quick understanding for decision-makers
Instead of multiple versions of the same story, teams work from a shared view, at the same time.